

328
K. B. Rajasekarababu and G. Vinayagamurthy
-1.2
-0.8
-0.4
0.0
0.4
0.8
1.2
Coarse
Medium
Fine
EXP[15]
3
2
1
Cp
0
0
3
1
2
x*/D
(a)
(b)
(c)
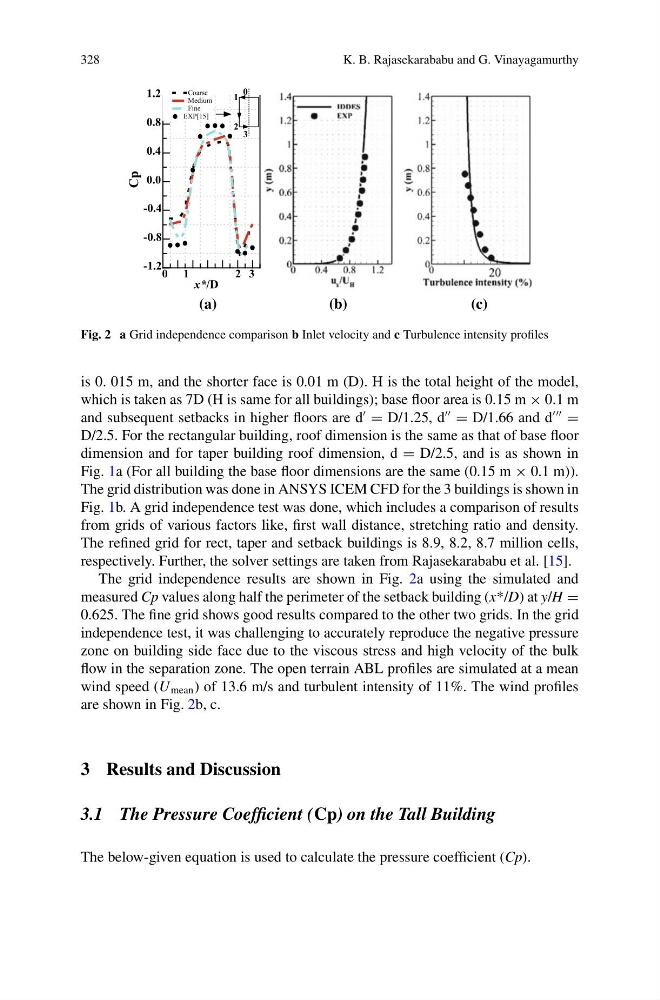
Fig. 2 a Grid independence comparison b Inlet velocity and c Turbulence intensity profiles
is 0. 015 m, and the shorter face is 0.01 m (D). H is the total height of the model,
which is taken as 7D (H is same for all buildings); base floor area is 0.15 m × 0.1 m
and subsequent setbacks in higher floors are d
= D/1.25, d
= D/1.66 and d
=
D/2.5. For the rectangular building, roof dimension is the same as that of base floor
dimension and for taper building roof dimension, d = D/2.5, and is as shown in
Fig. 1a (For all building the base floor dimensions are the same (0.15 m × 0.1 m)).
The grid distribution was done in ANSYS ICEM CFD for the 3 buildings is shown in
Fig. 1b. A grid independence test was done, which includes a comparison of results
from grids of various factors like, first wall distance, stretching ratio and density.
The refined grid for rect, taper and setback buildings is 8.9, 8.2, 8.7 million cells,
respectively. Further, the solver settings are taken from Rajasekarababu et al. [15].
The grid independence results are shown in Fig. 2a using the simulated and
measured Cp values along half the perimeter of the setback building (x*/D) at y/H =
0.625. The fine grid shows good results compared to the other two grids. In the grid
independence test, it was challenging to accurately reproduce the negative pressure
zone on building side face due to the viscous stress and high velocity of the bulk
flow in the separation zone. The open terrain ABL profiles are simulated at a mean
wind speed (U mean ) of 13.6 m/s and turbulent intensity of 11%. The wind profiles
are shown in Fig. 2b, c.
3 Results and Discussion
3.1 The Pressure Coefficient (Cp) on the Tall Building
The below-given equation is used to calculate the pressure coefficient (Cp).
K. B. Rajasekarababu and G. Vinayagamurthy
-1.2
-0.8
-0.4
0.0
0.4
0.8
1.2
Coarse
Medium
Fine
EXP[15]
3
2
1
Cp
0
0
3
1
2
x*/D
(a)
(b)
(c)
Fig. 2 a Grid independence comparison b Inlet velocity and c Turbulence intensity profiles
is 0. 015 m, and the shorter face is 0.01 m (D). H is the total height of the model,
which is taken as 7D (H is same for all buildings); base floor area is 0.15 m × 0.1 m
and subsequent setbacks in higher floors are d
= D/1.25, d
= D/1.66 and d
=
D/2.5. For the rectangular building, roof dimension is the same as that of base floor
dimension and for taper building roof dimension, d = D/2.5, and is as shown in
Fig. 1a (For all building the base floor dimensions are the same (0.15 m × 0.1 m)).
The grid distribution was done in ANSYS ICEM CFD for the 3 buildings is shown in
Fig. 1b. A grid independence test was done, which includes a comparison of results
from grids of various factors like, first wall distance, stretching ratio and density.
The refined grid for rect, taper and setback buildings is 8.9, 8.2, 8.7 million cells,
respectively. Further, the solver settings are taken from Rajasekarababu et al. [15].
The grid independence results are shown in Fig. 2a using the simulated and
measured Cp values along half the perimeter of the setback building (x*/D) at y/H =
0.625. The fine grid shows good results compared to the other two grids. In the grid
independence test, it was challenging to accurately reproduce the negative pressure
zone on building side face due to the viscous stress and high velocity of the bulk
flow in the separation zone. The open terrain ABL profiles are simulated at a mean
wind speed (U mean ) of 13.6 m/s and turbulent intensity of 11%. The wind profiles
are shown in Fig. 2b, c.
3 Results and Discussion
3.1 The Pressure Coefficient (Cp) on the Tall Building
The below-given equation is used to calculate the pressure coefficient (Cp).