

Assessment of Local Pressure Coefficient …
329
C p =
p − p 0
1
2
ρU
2
H
(1)
where p denotes is the extracted pressure from the required height. p 0 is the static
pressure at the reference height, ρ indicates the density of air (1.225 kg/m
3 ), U
2
H is
the mean wind velocity at the building’s reference height. The pressure coefficients
are measured below 10% of each setback height (see d, d
, d
in Fig. 1). The pressure
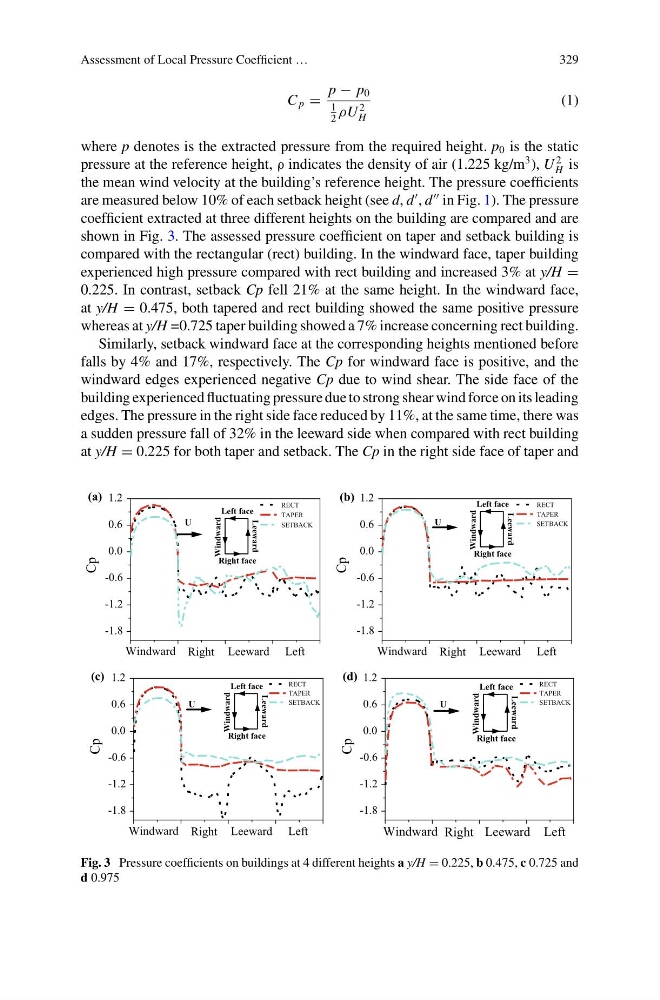
coefficient extracted at three different heights on the building are compared and are
shown in Fig. 3. The assessed pressure coefficient on taper and setback building is
compared with the rectangular (rect) building. In the windward face, taper building
experienced high pressure compared with rect building and increased 3% at y/H =
0.225. In contrast, setback Cp fell 21% at the same height. In the windward face,
at y/H = 0.475, both tapered and rect building showed the same positive pressure
whereas at y/H =0.725 taper building showed a 7% increase concerning rect building.
Similarly, setback windward face at the corresponding heights mentioned before
falls by 4% and 17%, respectively. The Cp for windward face is positive, and the
windward edges experienced negative Cp due to wind shear. The side face of the
building experienced fluctuating pressure due to strong shear wind force on its leading
edges. The pressure in the right side face reduced by 11%, at the same time, there was
a sudden pressure fall of 32% in the leeward side when compared with rect building
at y/H = 0.225 for both taper and setback. The Cp in the right side face of taper and
-1.8
-1.2
-0.6
0.0
0.6
1.2
U
Windward
Left face
Leeward
Right face
Left
Leeward
Right
Cp
RECT
TAPER
SETBACK
(a)
Windward
-1.8
-1.2
-0.6
0.0
0.6
1.2
Windward
Left face
Leeward
Right face
Left
Cp
RECT
TAPER
SETBACK
Leeward
Right
(b)
Windward
U
-1.8
-1.2
-0.6
0.0
0.6
1.2
Windward
Left face
Leeward
Right face
U
Left
Cp
RECT
TAPER
SETBACK
Leeward
Right
(c)
Windward
-1.8
-1.2
-0.6
0.0
0.6
1.2
(d)
Windward
Left face
Leeward
Right face
Cp
RECT
TAPER
SETBACK
U
Windward Right Leeward Left
Fig. 3 Pressure coefficients on buildings at 4 different heights a y/H = 0.225, b 0.475, c 0.725 and
d 0.975
329
C p =
p − p 0
1
2
ρU
2
H
(1)
where p denotes is the extracted pressure from the required height. p 0 is the static
pressure at the reference height, ρ indicates the density of air (1.225 kg/m
3 ), U
2
H is
the mean wind velocity at the building’s reference height. The pressure coefficients
are measured below 10% of each setback height (see d, d
, d
in Fig. 1). The pressure
coefficient extracted at three different heights on the building are compared and are
shown in Fig. 3. The assessed pressure coefficient on taper and setback building is
compared with the rectangular (rect) building. In the windward face, taper building
experienced high pressure compared with rect building and increased 3% at y/H =
0.225. In contrast, setback Cp fell 21% at the same height. In the windward face,
at y/H = 0.475, both tapered and rect building showed the same positive pressure
whereas at y/H =0.725 taper building showed a 7% increase concerning rect building.
Similarly, setback windward face at the corresponding heights mentioned before
falls by 4% and 17%, respectively. The Cp for windward face is positive, and the
windward edges experienced negative Cp due to wind shear. The side face of the
building experienced fluctuating pressure due to strong shear wind force on its leading
edges. The pressure in the right side face reduced by 11%, at the same time, there was
a sudden pressure fall of 32% in the leeward side when compared with rect building
at y/H = 0.225 for both taper and setback. The Cp in the right side face of taper and
-1.8
-1.2
-0.6
0.0
0.6
1.2
U
Windward
Left face
Leeward
Right face
Left
Leeward
Right
Cp
RECT
TAPER
SETBACK
(a)
Windward
-1.8
-1.2
-0.6
0.0
0.6
1.2
Windward
Left face
Leeward
Right face
Left
Cp
RECT
TAPER
SETBACK
Leeward
Right
(b)
Windward
U
-1.8
-1.2
-0.6
0.0
0.6
1.2
Windward
Left face
Leeward
Right face
U
Left
Cp
RECT
TAPER
SETBACK
Leeward
Right
(c)
Windward
-1.8
-1.2
-0.6
0.0
0.6
1.2
(d)
Windward
Left face
Leeward
Right face
Cp
RECT
TAPER
SETBACK
U
Windward Right Leeward Left
Fig. 3 Pressure coefficients on buildings at 4 different heights a y/H = 0.225, b 0.475, c 0.725 and
d 0.975