

Experimental Investigation on Geometric Accuracy …
215
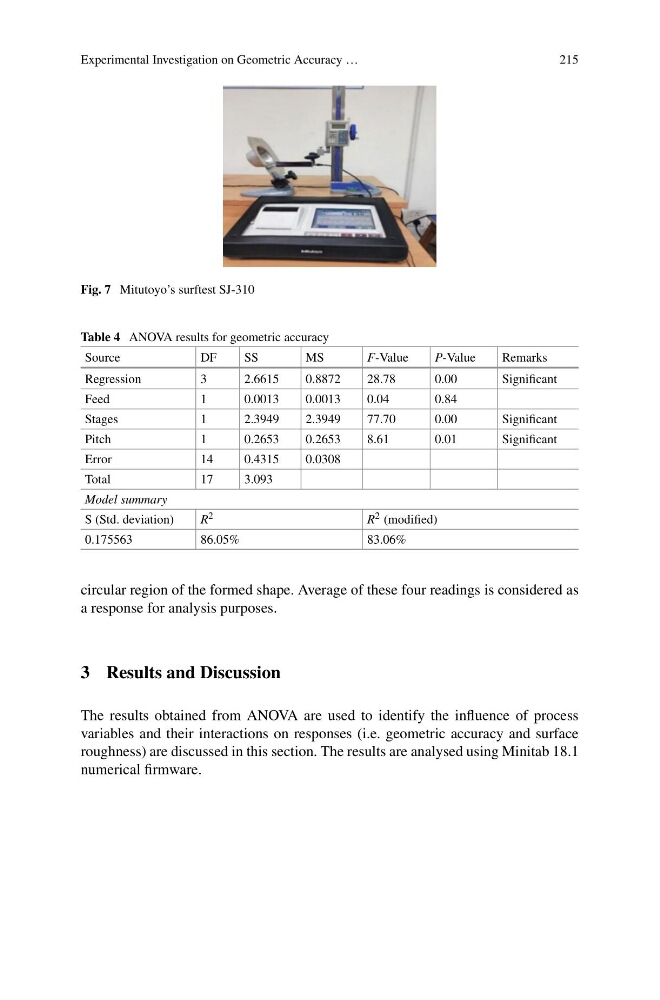
Fig. 7 Mitutoyo’s surftest SJ-310
Table 4 ANOVA results for geometric accuracy
Source
DF
SS
MS
F-Value
P-Value
Remarks
Regression
3
2.6615
0.8872
28.78
0.00
Significant
Feed
1
0.0013
0.0013
0.04
0.84
Stages
1
2.3949
2.3949
77.70
0.00
Significant
Pitch
1
0.2653
0.2653
8.61
0.01
Significant
Error
14
0.4315
0.0308
Total
17
3.093
Model summary
S (Std. deviation)
R 2
R 2 (modified)
0.175563
86.05%
83.06%
circular region of the formed shape. Average of these four readings is considered as
a response for analysis purposes.
3 Results and Discussion
The results obtained from ANOVA are used to identify the influence of process
variables and their interactions on responses (i.e. geometric accuracy and surface
roughness) are discussed in this section. The results are analysed using Minitab 18.1
numerical firmware.
215
Fig. 7 Mitutoyo’s surftest SJ-310
Table 4 ANOVA results for geometric accuracy
Source
DF
SS
MS
F-Value
P-Value
Remarks
Regression
3
2.6615
0.8872
28.78
0.00
Significant
Feed
1
0.0013
0.0013
0.04
0.84
Stages
1
2.3949
2.3949
77.70
0.00
Significant
Pitch
1
0.2653
0.2653
8.61
0.01
Significant
Error
14
0.4315
0.0308
Total
17
3.093
Model summary
S (Std. deviation)
R 2
R 2 (modified)
0.175563
86.05%
83.06%
circular region of the formed shape. Average of these four readings is considered as
a response for analysis purposes.
3 Results and Discussion
The results obtained from ANOVA are used to identify the influence of process
variables and their interactions on responses (i.e. geometric accuracy and surface
roughness) are discussed in this section. The results are analysed using Minitab 18.1
numerical firmware.