

216
S. Gajjar et al.
3.1 Geometric Accuracy
Table 4 shows the involvement of each factor to the overall variation that indicates
the extent of influence on the geometric accuracy in the Analysis of Variance. Table 4
clearly shows that the model’s p-value is less than 0.05, therefore model is significant. It is observed that number of stages and pitch sizes are significant process
variables and feed rate is insignificant. Thus, all three parameters significantly affect
the geometric error except the feed rate.
The R
2 statistics (i.e. R
2 and modified R
2 ) for the geometric error study are given
in Table 4. Values of R
2
= 86.05% suggest that the model describes 86.05% of the
overall variance of the geometric error. Values of R
2 modified = 83.06% suggest
that the model clarified 83.06% of overall variability. Geometric accuracy in terms
of RMSE varies within the range from 1.9028 to 3.23085 mm. Based on results a
regression formula for geometric error in terms of RMSE is given Eq. 2.
Geometric error( RMSE) = 3.189−0.000014 × F−0.4467 × N + 0.425 × P
(2)
where
F Feed rate;
N Number of stages;
P Pitch Size.
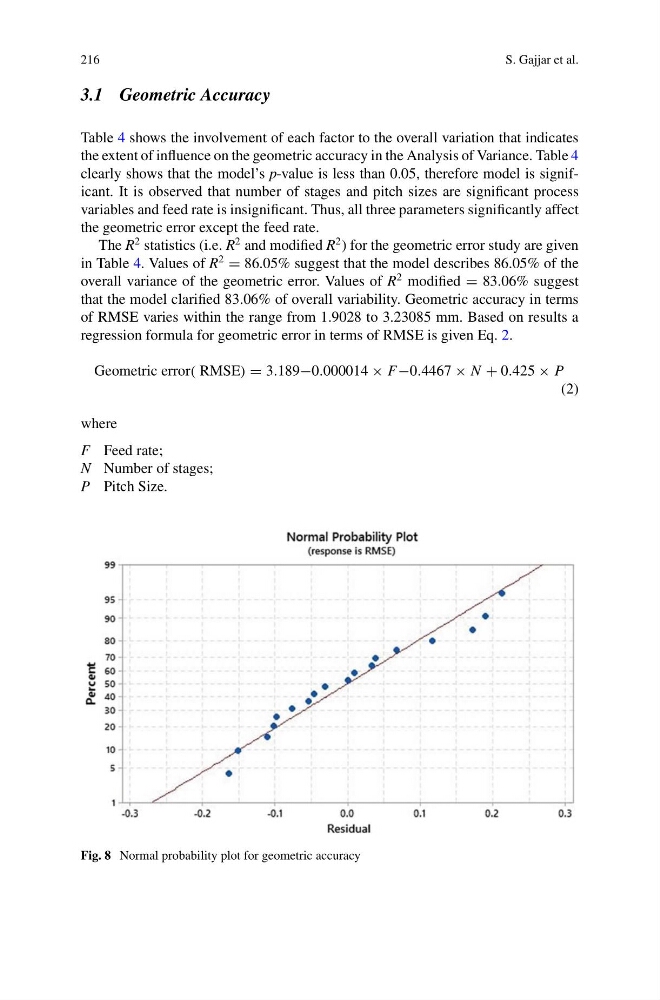
Fig. 8 Normal probability plot for geometric accuracy
S. Gajjar et al.
3.1 Geometric Accuracy
Table 4 shows the involvement of each factor to the overall variation that indicates
the extent of influence on the geometric accuracy in the Analysis of Variance. Table 4
clearly shows that the model’s p-value is less than 0.05, therefore model is significant. It is observed that number of stages and pitch sizes are significant process
variables and feed rate is insignificant. Thus, all three parameters significantly affect
the geometric error except the feed rate.
The R
2 statistics (i.e. R
2 and modified R
2 ) for the geometric error study are given
in Table 4. Values of R
2
= 86.05% suggest that the model describes 86.05% of the
overall variance of the geometric error. Values of R
2 modified = 83.06% suggest
that the model clarified 83.06% of overall variability. Geometric accuracy in terms
of RMSE varies within the range from 1.9028 to 3.23085 mm. Based on results a
regression formula for geometric error in terms of RMSE is given Eq. 2.
Geometric error( RMSE) = 3.189−0.000014 × F−0.4467 × N + 0.425 × P
(2)
where
F Feed rate;
N Number of stages;
P Pitch Size.
Fig. 8 Normal probability plot for geometric accuracy