

multidimensional 13-item index of competence. The score ranges from 0 to 13, and
lower scores indicate lower functional capacity. Deaths from any cause were linked
with Japanese national vital statistics during the period through 2015. The underlying cause of death was coded by using ICD-10 codes, and the relevant ICD-10 codes
were I00 to I99 for CVD and C00–C97 for cancer. Using data from beneficiaries of
National Health Insurance, health insurance for older people, and LTCI, I calculated
monthly medical costs, monthly long-term care costs, and the sum of these costs as
total cost for each participant for the period 1 year before the follow-up survey from
2001 through 2011. To exclude dramatic increases in medical and care expenditure,
monthly medical and long-term care costs were calculated for the period 1 year
before the follow-up survey. However, for participants who died within 1 year of
survey completion, costs were calculated for the 1-year interval from 2 years to
1 year before the date of death. Costs are expressed in US dollars (1 US dollar ¼ 112
Japanese yen on February 8, 2017). Data from the baseline survey showed that the
mean (SD) age of participants was 72.0 (6.2) years; 56.8% were women, 83.7% were
able to go out by themselves and 9.3% were independent in their home or
neighbourhood but could not travel far by themselves.
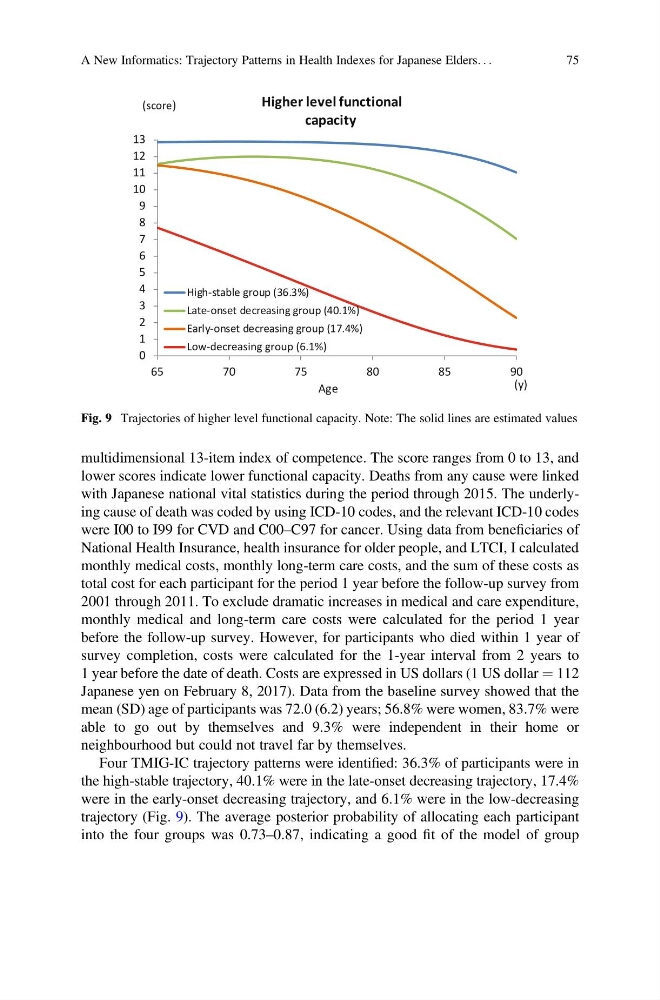
Four TMIG-IC trajectory patterns were identified: 36.3% of participants were in
the high-stable trajectory, 40.1% were in the late-onset decreasing trajectory, 17.4%
were in the early-onset decreasing trajectory, and 6.1% were in the low-decreasing
trajectory (Fig. 9). The average posterior probability of allocating each participant
into the four groups was 0.73–0.87, indicating a good fit of the model of group
0
1
2
3
4
5
6
7
8
9
10
11
12
13
65
70
75
80
85
90
High-stable group (36.3%)
Late-onset decreasing group (40.1%)
Early-onset decreasing group (17.4%)
Low-decreasing group (6.1%)
(y)
Higher level functional
capacity
Age
(score)
Fig. 9 Trajectories of higher level functional capacity. Note: The solid lines are estimated values
A New Informatics: Trajectory Patterns in Health Indexes for Japanese Elders. . .
75
lower scores indicate lower functional capacity. Deaths from any cause were linked
with Japanese national vital statistics during the period through 2015. The underlying cause of death was coded by using ICD-10 codes, and the relevant ICD-10 codes
were I00 to I99 for CVD and C00–C97 for cancer. Using data from beneficiaries of
National Health Insurance, health insurance for older people, and LTCI, I calculated
monthly medical costs, monthly long-term care costs, and the sum of these costs as
total cost for each participant for the period 1 year before the follow-up survey from
2001 through 2011. To exclude dramatic increases in medical and care expenditure,
monthly medical and long-term care costs were calculated for the period 1 year
before the follow-up survey. However, for participants who died within 1 year of
survey completion, costs were calculated for the 1-year interval from 2 years to
1 year before the date of death. Costs are expressed in US dollars (1 US dollar ¼ 112
Japanese yen on February 8, 2017). Data from the baseline survey showed that the
mean (SD) age of participants was 72.0 (6.2) years; 56.8% were women, 83.7% were
able to go out by themselves and 9.3% were independent in their home or
neighbourhood but could not travel far by themselves.
Four TMIG-IC trajectory patterns were identified: 36.3% of participants were in
the high-stable trajectory, 40.1% were in the late-onset decreasing trajectory, 17.4%
were in the early-onset decreasing trajectory, and 6.1% were in the low-decreasing
trajectory (Fig. 9). The average posterior probability of allocating each participant
into the four groups was 0.73–0.87, indicating a good fit of the model of group
0
1
2
3
4
5
6
7
8
9
10
11
12
13
65
70
75
80
85
90
High-stable group (36.3%)
Late-onset decreasing group (40.1%)
Early-onset decreasing group (17.4%)
Low-decreasing group (6.1%)
(y)
Higher level functional
capacity
Age
(score)
Fig. 9 Trajectories of higher level functional capacity. Note: The solid lines are estimated values
A New Informatics: Trajectory Patterns in Health Indexes for Japanese Elders. . .
75