

Anisotropic Magnetic Spin Interactions of Transition Metal …
53
Fe(II) Ni–C precursor state by photoreduction and dissociation of a proton to give
a Ni(I)–Fe(II) state with a vacant bridging position. This formally corresponds to a
two-electron reduction of the d
7 Ni(III) to a d
9 Ni(I) center.
In Ni–C, the g z -axis orientation is identical to that of the oxidized Ni(III) states
Ni–A and Ni–B. The calculated g-tensor axes orientation shows that the magnetic
g x and g y -axes are interchanged in Ni–C compared to the oxidized Ni–B and Ni–A
states [78] and related by a 90° rotation about the g z -axis. This information is only
available from calculations here and would not easily be resolved by analysis of the
single crystal EPR spectra. The calculated orientation of the magnetic axes agrees to
within 2–3° with the experimental ones (see Table 3). The g z axis of Ni–C is almost
perfectly oriented along the Ni–S(Cys549) bond (with an angle of 5° experimentally,
and 4° in the calculations). The magnetic x-axis is roughly along the Ni–S(Cys81)
bond (with an angle of 12° vs. 15°) and the orientation of g y displays angles of 14°
and 12° from the Ni–S(Cys84) bond direction.
For Ni–L, there are more assumptions going into the experimental assignment
of the g-tensor principal axes orientation. Since the rotational behavior of the EPR
transitions is similar to that of the enzyme in the Ni–C state (see Fig. 6), one possibility
is the absence of a significant magnetic re-orientation upon photoreduction although
the g-values do change. This would suggest a similar magnetic axes orientation to that
of the Ni–C state. The orientation of the g z -axis is also retained in Ni–L (within 2°),
whereas those of g x and g y are rotated in plane by 10°. This assignment is supported
by the DFT calculated g-tensor orientation to within 5–6° (see Table 3). Later, the
ground state of Ni–L was interpreted to result from a re-hybridization of the nickel
d-orbitals. In Ni–L, the nickel d x2 orbital points into the direction of the unoccupied
bridging position and forms a metal–metal bond with the iron d x2 orbital. As opposed
to the Ni–C state, the singly occupied molecular orbital in Ni–L is not a d z2 orbital
but a d z2–y2 orbital, which results in significantly altered magnetic properties [79].
4.3.2 Proton Hyperfine Coupling Tensors in Protein Single Crystals
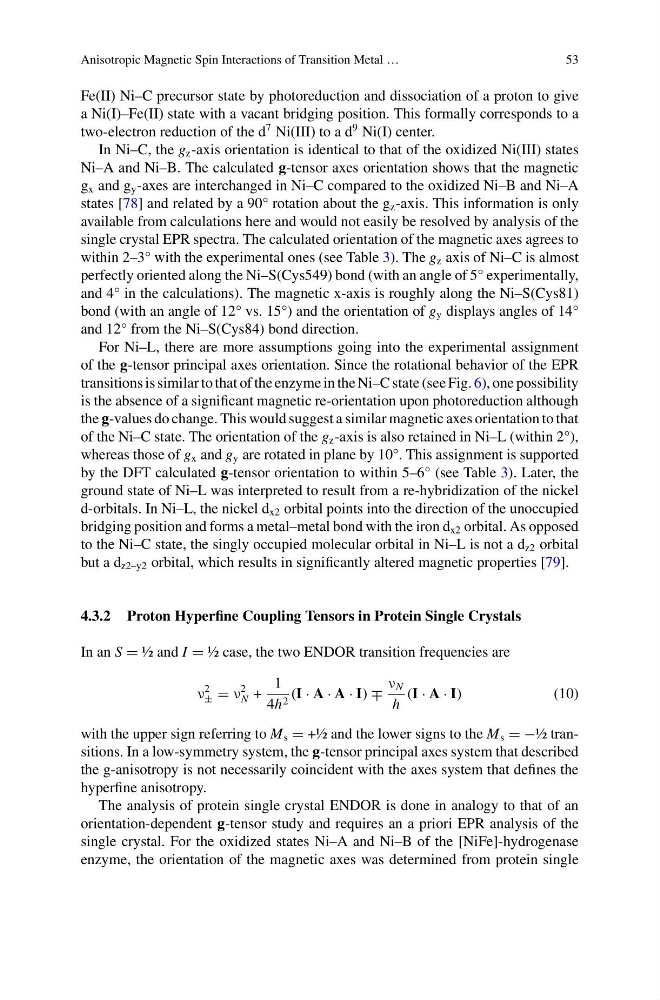
In an S ½ and I ½ case, the two ENDOR transition frequencies are
ν
2
± ν
2
N +
1
4h 2 (I · A · A · I) ∓
ν N
h
(I · A · I)
(10)
with the upper sign referring to M s +½ and the lower signs to the M s −½ transitions. In a low-symmetry system, the g-tensor principal axes system that described
the g-anisotropy is not necessarily coincident with the axes system that defines the
hyperfine anisotropy.
The analysis of protein single crystal ENDOR is done in analogy to that of an
orientation-dependent g-tensor study and requires an a priori EPR analysis of the
single crystal. For the oxidized states Ni–A and Ni–B of the [NiFe]-hydrogenase
enzyme, the orientation of the magnetic axes was determined from protein single
53
Fe(II) Ni–C precursor state by photoreduction and dissociation of a proton to give
a Ni(I)–Fe(II) state with a vacant bridging position. This formally corresponds to a
two-electron reduction of the d
7 Ni(III) to a d
9 Ni(I) center.
In Ni–C, the g z -axis orientation is identical to that of the oxidized Ni(III) states
Ni–A and Ni–B. The calculated g-tensor axes orientation shows that the magnetic
g x and g y -axes are interchanged in Ni–C compared to the oxidized Ni–B and Ni–A
states [78] and related by a 90° rotation about the g z -axis. This information is only
available from calculations here and would not easily be resolved by analysis of the
single crystal EPR spectra. The calculated orientation of the magnetic axes agrees to
within 2–3° with the experimental ones (see Table 3). The g z axis of Ni–C is almost
perfectly oriented along the Ni–S(Cys549) bond (with an angle of 5° experimentally,
and 4° in the calculations). The magnetic x-axis is roughly along the Ni–S(Cys81)
bond (with an angle of 12° vs. 15°) and the orientation of g y displays angles of 14°
and 12° from the Ni–S(Cys84) bond direction.
For Ni–L, there are more assumptions going into the experimental assignment
of the g-tensor principal axes orientation. Since the rotational behavior of the EPR
transitions is similar to that of the enzyme in the Ni–C state (see Fig. 6), one possibility
is the absence of a significant magnetic re-orientation upon photoreduction although
the g-values do change. This would suggest a similar magnetic axes orientation to that
of the Ni–C state. The orientation of the g z -axis is also retained in Ni–L (within 2°),
whereas those of g x and g y are rotated in plane by 10°. This assignment is supported
by the DFT calculated g-tensor orientation to within 5–6° (see Table 3). Later, the
ground state of Ni–L was interpreted to result from a re-hybridization of the nickel
d-orbitals. In Ni–L, the nickel d x2 orbital points into the direction of the unoccupied
bridging position and forms a metal–metal bond with the iron d x2 orbital. As opposed
to the Ni–C state, the singly occupied molecular orbital in Ni–L is not a d z2 orbital
but a d z2–y2 orbital, which results in significantly altered magnetic properties [79].
4.3.2 Proton Hyperfine Coupling Tensors in Protein Single Crystals
In an S ½ and I ½ case, the two ENDOR transition frequencies are
ν
2
± ν
2
N +
1
4h 2 (I · A · A · I) ∓
ν N
h
(I · A · I)
(10)
with the upper sign referring to M s +½ and the lower signs to the M s −½ transitions. In a low-symmetry system, the g-tensor principal axes system that described
the g-anisotropy is not necessarily coincident with the axes system that defines the
hyperfine anisotropy.
The analysis of protein single crystal ENDOR is done in analogy to that of an
orientation-dependent g-tensor study and requires an a priori EPR analysis of the
single crystal. For the oxidized states Ni–A and Ni–B of the [NiFe]-hydrogenase
enzyme, the orientation of the magnetic axes was determined from protein single