

52
M. Stein
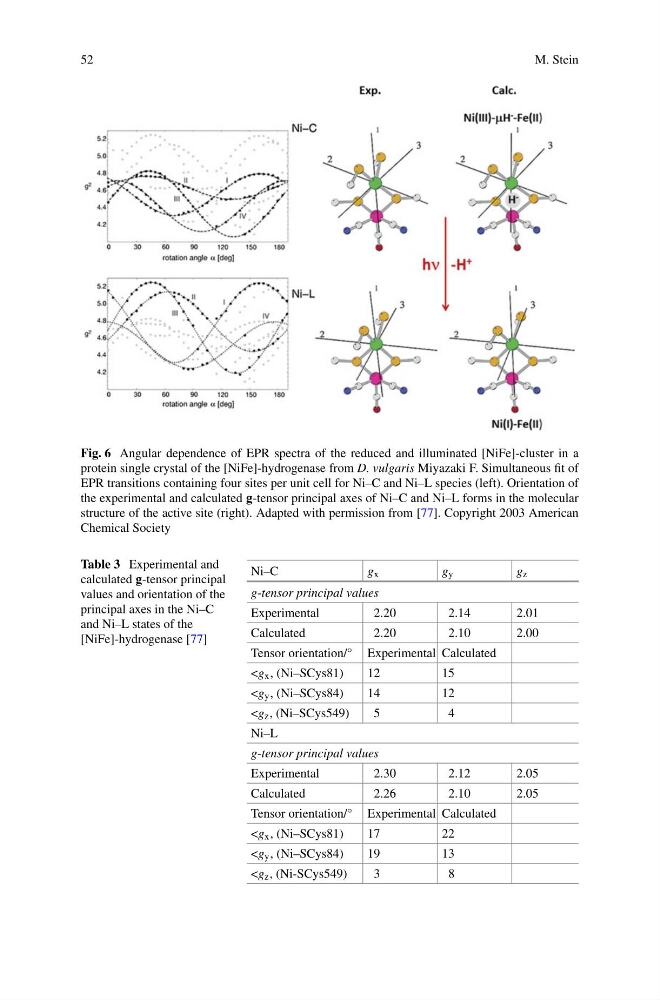
Fig. 6 Angular dependence of EPR spectra of the reduced and illuminated [NiFe]-cluster in a
protein single crystal of the [NiFe]-hydrogenase from D. vulgaris Miyazaki F. Simultaneous fit of
EPR transitions containing four sites per unit cell for Ni–C and Ni–L species (left). Orientation of
the experimental and calculated g-tensor principal axes of Ni–C and Ni–L forms in the molecular
structure of the active site (right). Adapted with permission from [77]. Copyright 2003 American
Chemical Society
Table 3 Experimental and
calculated g-tensor principal
values and orientation of the
principal axes in the Ni–C
and Ni–L states of the
[NiFe]-hydrogenase [77]
Ni–C
g x
g y
g z
g-tensor principal values
Experimental
2.20
2.14
2.01
Calculated
2.20
2.10
2.00
Tensor orientation/° Experimental Calculated
15
12
4
Ni–L
g-tensor principal values
Experimental
2.30
2.12
2.05
Calculated
2.26
2.10
2.05
Tensor orientation/° Experimental Calculated
22
13
8
M. Stein
Fig. 6 Angular dependence of EPR spectra of the reduced and illuminated [NiFe]-cluster in a
protein single crystal of the [NiFe]-hydrogenase from D. vulgaris Miyazaki F. Simultaneous fit of
EPR transitions containing four sites per unit cell for Ni–C and Ni–L species (left). Orientation of
the experimental and calculated g-tensor principal axes of Ni–C and Ni–L forms in the molecular
structure of the active site (right). Adapted with permission from [77]. Copyright 2003 American
Chemical Society
Table 3 Experimental and
calculated g-tensor principal
values and orientation of the
principal axes in the Ni–C
and Ni–L states of the
[NiFe]-hydrogenase [77]
Ni–C
g x
g y
g z
g-tensor principal values
Experimental
2.20
2.14
2.01
Calculated
2.20
2.10
2.00
Tensor orientation/° Experimental Calculated
15
12
4
Ni–L
g-tensor principal values
Experimental
2.30
2.12
2.05
Calculated
2.26
2.10
2.05
Tensor orientation/° Experimental Calculated
22
13
8