

56
5 Calibration
The analyte concentration in a test sample is determined by interpolation of the
signal obtained for the sample to the Y -axis corresponding to the value of an analyte
on the X axis [the second step in the definition of calibration (Clause 2.39, ISO/IEC
Guide 99)].
The calibration dependence is often established with a number of standards, and
the measurement points are used for plotting the respective line. In practice, points
are not positioned in the ideal straight line, a certain spread of data results from
random errors. Therefore, a regression line is carried out through the designated
measurement points—the line of best fit to the data points. The degree of coherence
of measurement points to a straight line is determined by the correlation coefficient.
In principle, the graph of the calibration dependence should start at the origin, i.e., in
the absence of an analyte in a sample, the measuring point should correspond to the
coordinates {0.0}. Considering, however, that the measurement result is affected by
the noise of the measuring system and the fact that a sample blank can contain trace
amounts of substance (non-removable), frequently the intersection with the Y -axis
is not at zero, but slightly above zero (a factor in the equation depending on the
calibration).
In the case of the linear dependence between C and y, two points are sufficient
to establish the graph, but in analytical practice, it is recommended to use three or
even five standards with increasing concentrations of an analyte. A larger number of
measurement points results in reducing the impact of random errors. In addition, it
allows a better evaluation of the dependencies. If the relationship is nonlinear, using
a larger number of measurement points enables two or more linear ranges over the
entire range of concentrations to be distinguished.
The correlation coefficient is used to assess the degree of linearity of the dependence
of two variables. If the calibration is judged according to the linearity of the analytical
signal (the response of the instrument) to the concentration or mass of the analyte
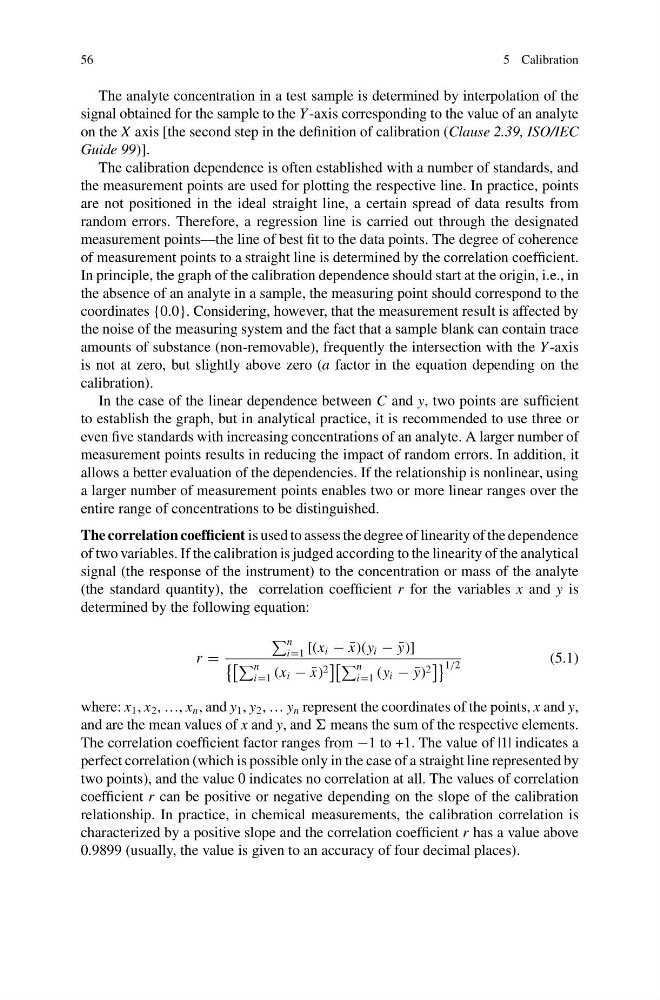
(the standard quantity), the correlation coefficient r for the variables x and y is
determined by the following equation:
r
n
i1 [(x i − ¯
x)(y i − ¯
y)]
n
i1 (x i − ¯
x) 2
n
i1 (y i − ¯
y) 2
1/2
(5.1)
where: x 1 , x 2 , …, x n , and y 1 , y 2 , … y n represent the coordinates of the points, x and y,
and are the mean values of x and y, and means the sum of the respective elements.
The correlation coefficient factor ranges from −1 to +1. The value of |1| indicates a
perfect correlation (which is possible only in the case of a straight line represented by
two points), and the value 0 indicates no correlation at all. The values of correlation
coefficient r can be positive or negative depending on the slope of the calibration
relationship. In practice, in chemical measurements, the calibration correlation is
characterized by a positive slope and the correlation coefficient r has a value above
0.9899 (usually, the value is given to an accuracy of four decimal places).
5 Calibration
The analyte concentration in a test sample is determined by interpolation of the
signal obtained for the sample to the Y -axis corresponding to the value of an analyte
on the X axis [the second step in the definition of calibration (Clause 2.39, ISO/IEC
Guide 99)].
The calibration dependence is often established with a number of standards, and
the measurement points are used for plotting the respective line. In practice, points
are not positioned in the ideal straight line, a certain spread of data results from
random errors. Therefore, a regression line is carried out through the designated
measurement points—the line of best fit to the data points. The degree of coherence
of measurement points to a straight line is determined by the correlation coefficient.
In principle, the graph of the calibration dependence should start at the origin, i.e., in
the absence of an analyte in a sample, the measuring point should correspond to the
coordinates {0.0}. Considering, however, that the measurement result is affected by
the noise of the measuring system and the fact that a sample blank can contain trace
amounts of substance (non-removable), frequently the intersection with the Y -axis
is not at zero, but slightly above zero (a factor in the equation depending on the
calibration).
In the case of the linear dependence between C and y, two points are sufficient
to establish the graph, but in analytical practice, it is recommended to use three or
even five standards with increasing concentrations of an analyte. A larger number of
measurement points results in reducing the impact of random errors. In addition, it
allows a better evaluation of the dependencies. If the relationship is nonlinear, using
a larger number of measurement points enables two or more linear ranges over the
entire range of concentrations to be distinguished.
The correlation coefficient is used to assess the degree of linearity of the dependence
of two variables. If the calibration is judged according to the linearity of the analytical
signal (the response of the instrument) to the concentration or mass of the analyte
(the standard quantity), the correlation coefficient r for the variables x and y is
determined by the following equation:
r
n
i1 [(x i − ¯
x)(y i − ¯
y)]
n
i1 (x i − ¯
x) 2
n
i1 (y i − ¯
y) 2
1/2
(5.1)
where: x 1 , x 2 , …, x n , and y 1 , y 2 , … y n represent the coordinates of the points, x and y,
and are the mean values of x and y, and means the sum of the respective elements.
The correlation coefficient factor ranges from −1 to +1. The value of |1| indicates a
perfect correlation (which is possible only in the case of a straight line represented by
two points), and the value 0 indicates no correlation at all. The values of correlation
coefficient r can be positive or negative depending on the slope of the calibration
relationship. In practice, in chemical measurements, the calibration correlation is
characterized by a positive slope and the correlation coefficient r has a value above
0.9899 (usually, the value is given to an accuracy of four decimal places).