

5 Calibration
57
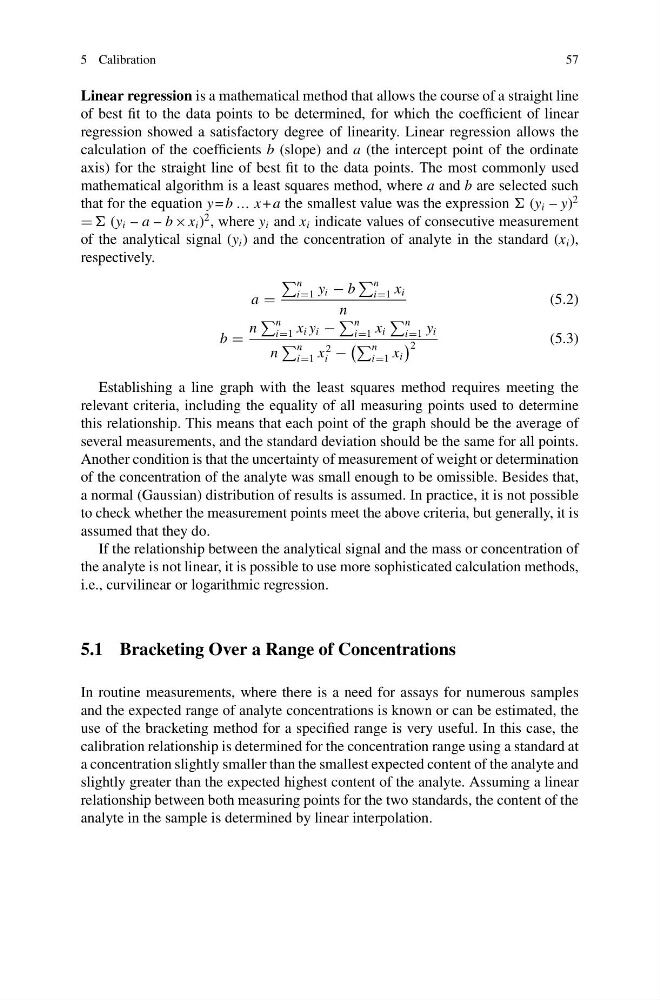
Linear regression is a mathematical method that allows the course of a straight line
of best fit to the data points to be determined, for which the coefficient of linear
regression showed a satisfactory degree of linearity. Linear regression allows the
calculation of the coefficients b (slope) and a (the intercept point of the ordinate
axis) for the straight line of best fit to the data points. The most commonly used
mathematical algorithm is a least squares method, where a and b are selected such
that for the equation y = b … x+ a the smallest value was the expression (y i – y)
2
(y i – a – b × x i )
2 , where y i and x i indicate values of consecutive measurement
of the analytical signal (y i ) and the concentration of analyte in the standard (x i ),
respectively.
a
n
i1 y i − b
n
i1 x i
n
(5.2)
b
n
n
i1 x i y i −
n
i1 x i
n
i1 y i
n
n
i1 x
2
i −
n
i1 x i
2
(5.3)
Establishing a line graph with the least squares method requires meeting the
relevant criteria, including the equality of all measuring points used to determine
this relationship. This means that each point of the graph should be the average of
several measurements, and the standard deviation should be the same for all points.
Another condition is that the uncertainty of measurement of weight or determination
of the concentration of the analyte was small enough to be omissible. Besides that,
a normal (Gaussian) distribution of results is assumed. In practice, it is not possible
to check whether the measurement points meet the above criteria, but generally, it is
assumed that they do.
If the relationship between the analytical signal and the mass or concentration of
the analyte is not linear, it is possible to use more sophisticated calculation methods,
i.e., curvilinear or logarithmic regression.
5.1 Bracketing Over a Range of Concentrations
In routine measurements, where there is a need for assays for numerous samples
and the expected range of analyte concentrations is known or can be estimated, the
use of the bracketing method for a specified range is very useful. In this case, the
calibration relationship is determined for the concentration range using a standard at
a concentration slightly smaller than the smallest expected content of the analyte and
slightly greater than the expected highest content of the analyte. Assuming a linear
relationship between both measuring points for the two standards, the content of the
analyte in the sample is determined by linear interpolation.
57
Linear regression is a mathematical method that allows the course of a straight line
of best fit to the data points to be determined, for which the coefficient of linear
regression showed a satisfactory degree of linearity. Linear regression allows the
calculation of the coefficients b (slope) and a (the intercept point of the ordinate
axis) for the straight line of best fit to the data points. The most commonly used
mathematical algorithm is a least squares method, where a and b are selected such
that for the equation y = b … x+ a the smallest value was the expression (y i – y)
2
(y i – a – b × x i )
2 , where y i and x i indicate values of consecutive measurement
of the analytical signal (y i ) and the concentration of analyte in the standard (x i ),
respectively.
a
n
i1 y i − b
n
i1 x i
n
(5.2)
b
n
n
i1 x i y i −
n
i1 x i
n
i1 y i
n
n
i1 x
2
i −
n
i1 x i
2
(5.3)
Establishing a line graph with the least squares method requires meeting the
relevant criteria, including the equality of all measuring points used to determine
this relationship. This means that each point of the graph should be the average of
several measurements, and the standard deviation should be the same for all points.
Another condition is that the uncertainty of measurement of weight or determination
of the concentration of the analyte was small enough to be omissible. Besides that,
a normal (Gaussian) distribution of results is assumed. In practice, it is not possible
to check whether the measurement points meet the above criteria, but generally, it is
assumed that they do.
If the relationship between the analytical signal and the mass or concentration of
the analyte is not linear, it is possible to use more sophisticated calculation methods,
i.e., curvilinear or logarithmic regression.
5.1 Bracketing Over a Range of Concentrations
In routine measurements, where there is a need for assays for numerous samples
and the expected range of analyte concentrations is known or can be estimated, the
use of the bracketing method for a specified range is very useful. In this case, the
calibration relationship is determined for the concentration range using a standard at
a concentration slightly smaller than the smallest expected content of the analyte and
slightly greater than the expected highest content of the analyte. Assuming a linear
relationship between both measuring points for the two standards, the content of the
analyte in the sample is determined by linear interpolation.