

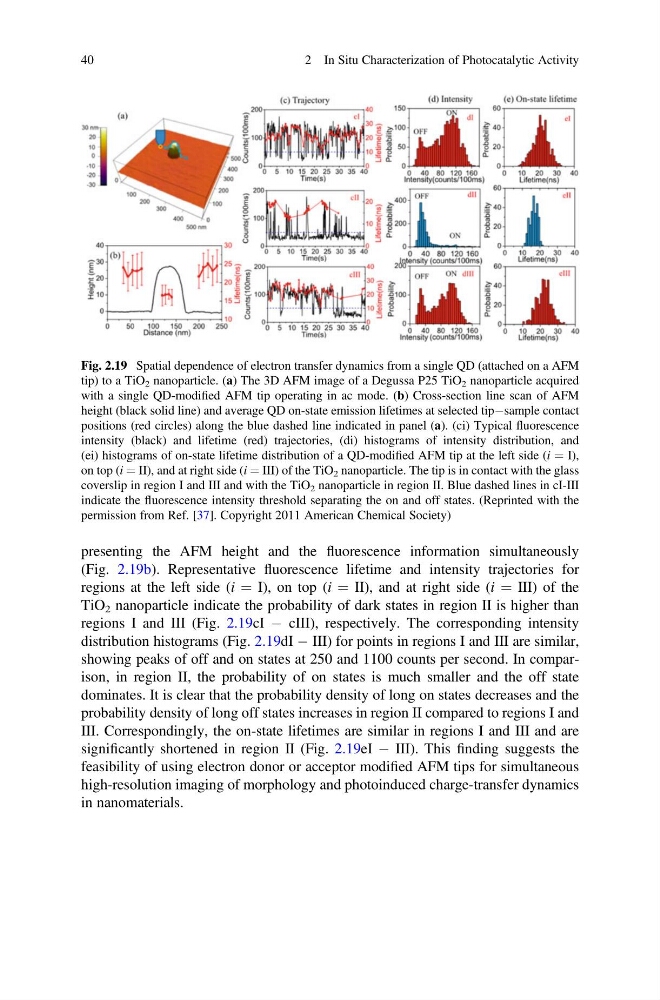
presenting the AFM height and the fluorescence information simultaneously
(Fig. 2.19b). Representative fluorescence lifetime and intensity trajectories for
regions at the left side (i ¼ I), on top (i ¼ II), and at right side (i ¼ III) of the
TiO 2 nanoparticle indicate the probability of dark states in region II is higher than
regions I and III (Fig. 2.19cI À cIII), respectively. The corresponding intensity
distribution histograms (Fig. 2.19dI À III) for points in regions I and III are similar,
showing peaks of off and on states at 250 and 1100 counts per second. In comparison, in region II, the probability of on states is much smaller and the off state
dominates. It is clear that the probability density of long on states decreases and the
probability density of long off states increases in region II compared to regions I and
III. Correspondingly, the on-state lifetimes are similar in regions I and III and are
significantly shortened in region II (Fig. 2.19eI À III). This finding suggests the
feasibility of using electron donor or acceptor modified AFM tips for simultaneous
high-resolution imaging of morphology and photoinduced charge-transfer dynamics
in nanomaterials.
Fig. 2.19 Spatial dependence of electron transfer dynamics from a single QD (attached on a AFM
tip) to a TiO 2 nanoparticle. (a) The 3D AFM image of a Degussa P25 TiO 2 nanoparticle acquired
with a single QD-modified AFM tip operating in ac mode. (b) Cross-section line scan of AFM
height (black solid line) and average QD on-state emission lifetimes at selected tipÀsample contact
positions (red circles) along the blue dashed line indicated in panel (a). (ci) Typical fluorescence
intensity (black) and lifetime (red) trajectories, (di) histograms of intensity distribution, and
(ei) histograms of on-state lifetime distribution of a QD-modified AFM tip at the left side (i ¼ I),
on top (i ¼ II), and at right side (i ¼ III) of the TiO 2 nanoparticle. The tip is in contact with the glass
coverslip in region I and III and with the TiO 2 nanoparticle in region II. Blue dashed lines in cI-III
indicate the fluorescence intensity threshold separating the on and off states. (Reprinted with the
permission from Ref. [37]. Copyright 2011 American Chemical Society)
40
2 In Situ Characterization of Photocatalytic Activity
(Fig. 2.19b). Representative fluorescence lifetime and intensity trajectories for
regions at the left side (i ¼ I), on top (i ¼ II), and at right side (i ¼ III) of the
TiO 2 nanoparticle indicate the probability of dark states in region II is higher than
regions I and III (Fig. 2.19cI À cIII), respectively. The corresponding intensity
distribution histograms (Fig. 2.19dI À III) for points in regions I and III are similar,
showing peaks of off and on states at 250 and 1100 counts per second. In comparison, in region II, the probability of on states is much smaller and the off state
dominates. It is clear that the probability density of long on states decreases and the
probability density of long off states increases in region II compared to regions I and
III. Correspondingly, the on-state lifetimes are similar in regions I and III and are
significantly shortened in region II (Fig. 2.19eI À III). This finding suggests the
feasibility of using electron donor or acceptor modified AFM tips for simultaneous
high-resolution imaging of morphology and photoinduced charge-transfer dynamics
in nanomaterials.
Fig. 2.19 Spatial dependence of electron transfer dynamics from a single QD (attached on a AFM
tip) to a TiO 2 nanoparticle. (a) The 3D AFM image of a Degussa P25 TiO 2 nanoparticle acquired
with a single QD-modified AFM tip operating in ac mode. (b) Cross-section line scan of AFM
height (black solid line) and average QD on-state emission lifetimes at selected tipÀsample contact
positions (red circles) along the blue dashed line indicated in panel (a). (ci) Typical fluorescence
intensity (black) and lifetime (red) trajectories, (di) histograms of intensity distribution, and
(ei) histograms of on-state lifetime distribution of a QD-modified AFM tip at the left side (i ¼ I),
on top (i ¼ II), and at right side (i ¼ III) of the TiO 2 nanoparticle. The tip is in contact with the glass
coverslip in region I and III and with the TiO 2 nanoparticle in region II. Blue dashed lines in cI-III
indicate the fluorescence intensity threshold separating the on and off states. (Reprinted with the
permission from Ref. [37]. Copyright 2011 American Chemical Society)
40
2 In Situ Characterization of Photocatalytic Activity