

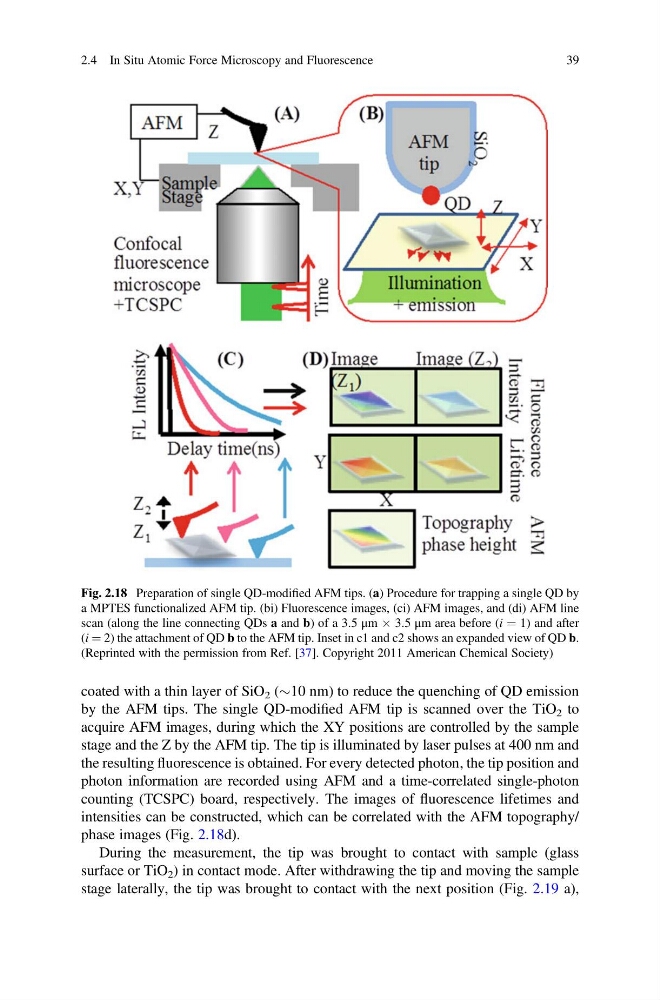
coated with a thin layer of SiO 2 ($10 nm) to reduce the quenching of QD emission
by the AFM tips. The single QD-modified AFM tip is scanned over the TiO 2 to
acquire AFM images, during which the XY positions are controlled by the sample
stage and the Z by the AFM tip. The tip is illuminated by laser pulses at 400 nm and
the resulting fluorescence is obtained. For every detected photon, the tip position and
photon information are recorded using AFM and a time-correlated single-photon
counting (TCSPC) board, respectively. The images of fluorescence lifetimes and
intensities can be constructed, which can be correlated with the AFM topography/
phase images (Fig. 2.18d).
During the measurement, the tip was brought to contact with sample (glass
surface or TiO 2 ) in contact mode. After withdrawing the tip and moving the sample
stage laterally, the tip was brought to contact with the next position (Fig. 2.19 a),
Fig. 2.18 Preparation of single QD-modified AFM tips. (a) Procedure for trapping a single QD by
a MPTES functionalized AFM tip. (bi) Fluorescence images, (ci) AFM images, and (di) AFM line
scan (along the line connecting QDs a and b) of a 3.5 μm  3.5 μm area before (i ¼ 1) and after
(i ¼ 2) the attachment of QD b to the AFM tip. Inset in c1 and c2 shows an expanded view of QD b.
(Reprinted with the permission from Ref. [37]. Copyright 2011 American Chemical Society)
2.4 In Situ Atomic Force Microscopy and Fluorescence
39
by the AFM tips. The single QD-modified AFM tip is scanned over the TiO 2 to
acquire AFM images, during which the XY positions are controlled by the sample
stage and the Z by the AFM tip. The tip is illuminated by laser pulses at 400 nm and
the resulting fluorescence is obtained. For every detected photon, the tip position and
photon information are recorded using AFM and a time-correlated single-photon
counting (TCSPC) board, respectively. The images of fluorescence lifetimes and
intensities can be constructed, which can be correlated with the AFM topography/
phase images (Fig. 2.18d).
During the measurement, the tip was brought to contact with sample (glass
surface or TiO 2 ) in contact mode. After withdrawing the tip and moving the sample
stage laterally, the tip was brought to contact with the next position (Fig. 2.19 a),
Fig. 2.18 Preparation of single QD-modified AFM tips. (a) Procedure for trapping a single QD by
a MPTES functionalized AFM tip. (bi) Fluorescence images, (ci) AFM images, and (di) AFM line
scan (along the line connecting QDs a and b) of a 3.5 μm  3.5 μm area before (i ¼ 1) and after
(i ¼ 2) the attachment of QD b to the AFM tip. Inset in c1 and c2 shows an expanded view of QD b.
(Reprinted with the permission from Ref. [37]. Copyright 2011 American Chemical Society)
2.4 In Situ Atomic Force Microscopy and Fluorescence
39