

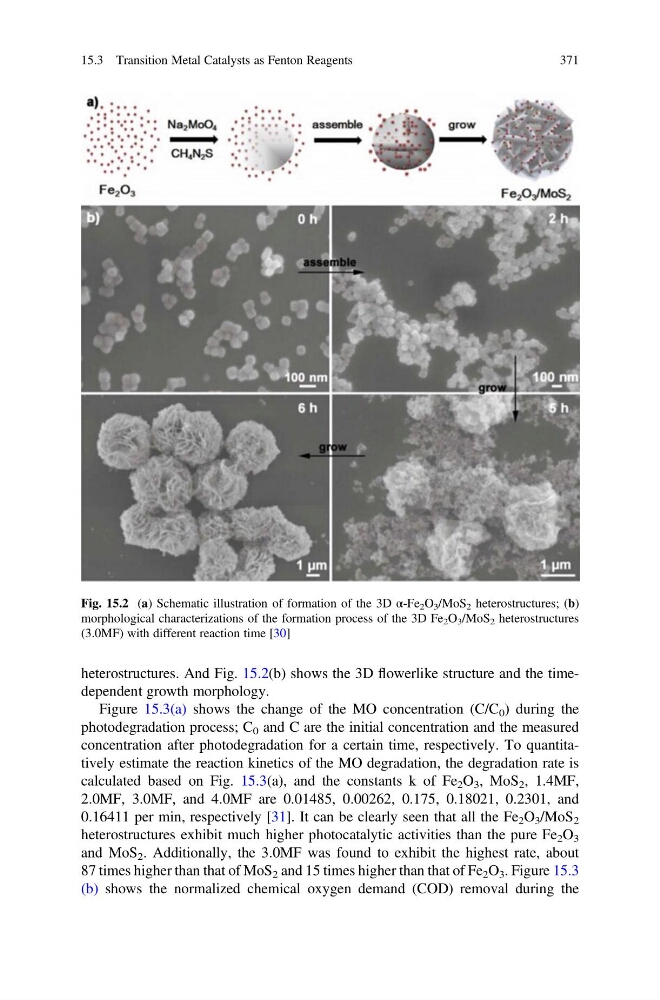
heterostructures. And Fig. 15.2(b) shows the 3D flowerlike structure and the timedependent growth morphology.
Figure 15.3(a) shows the change of the MO concentration (C/C 0 ) during the
photodegradation process; C 0 and C are the initial concentration and the measured
concentration after photodegradation for a certain time, respectively. To quantitatively estimate the reaction kinetics of the MO degradation, the degradation rate is
calculated based on Fig. 15.3(a), and the constants k of Fe 2 O 3 , MoS 2 , 1.4MF,
2.0MF, 3.0MF, and 4.0MF are 0.01485, 0.00262, 0.175, 0.18021, 0.2301, and
0.16411 per min, respectively [31]. It can be clearly seen that all the Fe 2 O 3 /MoS 2
heterostructures exhibit much higher photocatalytic activities than the pure Fe 2 O 3
and MoS 2 . Additionally, the 3.0MF was found to exhibit the highest rate, about
87 times higher than that of MoS 2 and 15 times higher than that of Fe 2 O 3 . Figure 15.3
(b) shows the normalized chemical oxygen demand (COD) removal during the
Fig. 15.2 (a) Schematic illustration of formation of the 3D α-Fe 2 O 3 /MoS 2 heterostructures; (b)
morphological characterizations of the formation process of the 3D Fe 2 O 3 /MoS 2 heterostructures
(3.0MF) with different reaction time [30]
15.3 Transition Metal Catalysts as Fenton Reagents
371
Figure 15.3(a) shows the change of the MO concentration (C/C 0 ) during the
photodegradation process; C 0 and C are the initial concentration and the measured
concentration after photodegradation for a certain time, respectively. To quantitatively estimate the reaction kinetics of the MO degradation, the degradation rate is
calculated based on Fig. 15.3(a), and the constants k of Fe 2 O 3 , MoS 2 , 1.4MF,
2.0MF, 3.0MF, and 4.0MF are 0.01485, 0.00262, 0.175, 0.18021, 0.2301, and
0.16411 per min, respectively [31]. It can be clearly seen that all the Fe 2 O 3 /MoS 2
heterostructures exhibit much higher photocatalytic activities than the pure Fe 2 O 3
and MoS 2 . Additionally, the 3.0MF was found to exhibit the highest rate, about
87 times higher than that of MoS 2 and 15 times higher than that of Fe 2 O 3 . Figure 15.3
(b) shows the normalized chemical oxygen demand (COD) removal during the
Fig. 15.2 (a) Schematic illustration of formation of the 3D α-Fe 2 O 3 /MoS 2 heterostructures; (b)
morphological characterizations of the formation process of the 3D Fe 2 O 3 /MoS 2 heterostructures
(3.0MF) with different reaction time [30]
15.3 Transition Metal Catalysts as Fenton Reagents
371