

intimate interface, which implies the existence of heterojunction between C 3 N 4 and
NaNbO 3 . The band structures of g-C 3 N 4 and NaNbO 3 were determined by UV–vis
DRS and VB-XPS in Fig. 12.6 (b, c). The wavelength (λ) of adsorption edge of
g-C 3 N 4 and NaNbO 3 is 365 nm and 450 nm, respectively; therefore, the E g (bandgap
energy ¼ 1240/λ) was calculated to be 3.4 eV and 2.7 eV, respectively. Meanwhile,
the VB XPS result shows that the E VB (valence band energy) of g-C 3 N 4 and NaNbO 3
was located at ~1.57 eV and 2.7 eV, respectively; therefore, the E CB (conduction
band energy) of g-C 3 N 4 and NaNbO 3 was calculated to be À1.13 eV and À 0.77 eV
based on the equation E CB ¼ E VB – E g . Since the CB level of C 3 N 4 is more negative
than NaNbO 3 , the photo-excited electrons from C 3 N 4 could migrate to NaNbO 3 and
suppress the electron-hole carriers’ recombination.
Although p–n heterojunctions greatly inhibit the recombination of photogenerated electrons and holes, however, after the photo-generated electrons migrate
to the CB with lower reduction potential, the redox ability of the integral composite
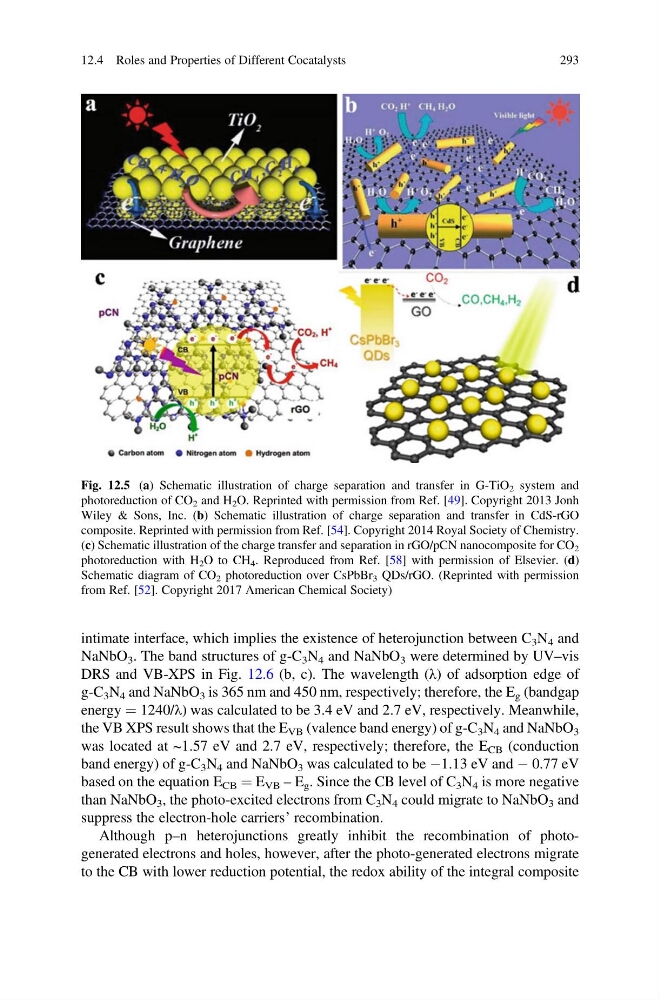
Fig. 12.5 (a) Schematic illustration of charge separation and transfer in G-TiO 2 system and
photoreduction of CO 2 and H 2 O. Reprinted with permission from Ref. [49]. Copyright 2013 Jonh
Wiley & Sons, Inc. (b) Schematic illustration of charge separation and transfer in CdS-rGO
composite. Reprinted with permission from Ref. [54]. Copyright 2014 Royal Society of Chemistry.
(c) Schematic illustration of the charge transfer and separation in rGO/pCN nanocomposite for CO 2
photoreduction with H 2 O to CH 4 . Reproduced from Ref. [58] with permission of Elsevier. (d)
Schematic diagram of CO 2 photoreduction over CsPbBr 3 QDs/rGO. (Reprinted with permission
from Ref. [52]. Copyright 2017 American Chemical Society)
12.4 Roles and Properties of Different Cocatalysts
293
NaNbO 3 . The band structures of g-C 3 N 4 and NaNbO 3 were determined by UV–vis
DRS and VB-XPS in Fig. 12.6 (b, c). The wavelength (λ) of adsorption edge of
g-C 3 N 4 and NaNbO 3 is 365 nm and 450 nm, respectively; therefore, the E g (bandgap
energy ¼ 1240/λ) was calculated to be 3.4 eV and 2.7 eV, respectively. Meanwhile,
the VB XPS result shows that the E VB (valence band energy) of g-C 3 N 4 and NaNbO 3
was located at ~1.57 eV and 2.7 eV, respectively; therefore, the E CB (conduction
band energy) of g-C 3 N 4 and NaNbO 3 was calculated to be À1.13 eV and À 0.77 eV
based on the equation E CB ¼ E VB – E g . Since the CB level of C 3 N 4 is more negative
than NaNbO 3 , the photo-excited electrons from C 3 N 4 could migrate to NaNbO 3 and
suppress the electron-hole carriers’ recombination.
Although p–n heterojunctions greatly inhibit the recombination of photogenerated electrons and holes, however, after the photo-generated electrons migrate
to the CB with lower reduction potential, the redox ability of the integral composite
Fig. 12.5 (a) Schematic illustration of charge separation and transfer in G-TiO 2 system and
photoreduction of CO 2 and H 2 O. Reprinted with permission from Ref. [49]. Copyright 2013 Jonh
Wiley & Sons, Inc. (b) Schematic illustration of charge separation and transfer in CdS-rGO
composite. Reprinted with permission from Ref. [54]. Copyright 2014 Royal Society of Chemistry.
(c) Schematic illustration of the charge transfer and separation in rGO/pCN nanocomposite for CO 2
photoreduction with H 2 O to CH 4 . Reproduced from Ref. [58] with permission of Elsevier. (d)
Schematic diagram of CO 2 photoreduction over CsPbBr 3 QDs/rGO. (Reprinted with permission
from Ref. [52]. Copyright 2017 American Chemical Society)
12.4 Roles and Properties of Different Cocatalysts
293