

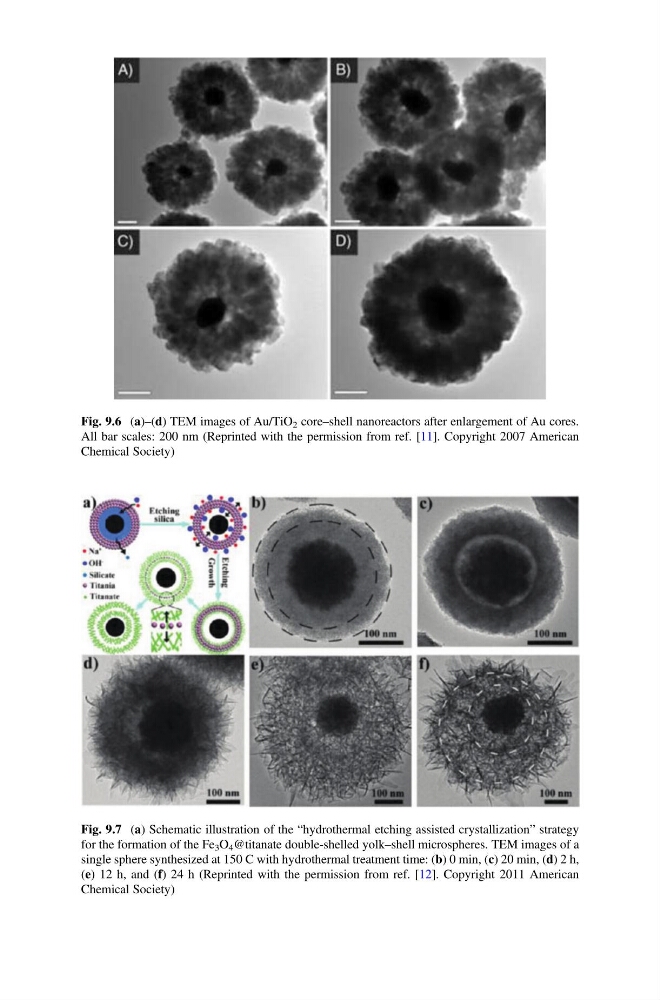
Fig. 9.6 (a)–(d) TEM images of Au/TiO 2 core–shell nanoreactors after enlargement of Au cores.
All bar scales: 200 nm (Reprinted with the permission from ref. [11]. Copyright 2007 American
Chemical Society)
Fig. 9.7 (a) Schematic illustration of the “hydrothermal etching assisted crystallization” strategy
for the formation of the Fe 3 O 4 @titanate double-shelled yolk–shell microspheres. TEM images of a
single sphere synthesized at 150 C with hydrothermal treatment time: (b) 0 min, (c) 20 min, (d) 2 h,
(e) 12 h, and (f) 24 h (Reprinted with the permission from ref. [12]. Copyright 2011 American
Chemical Society)
All bar scales: 200 nm (Reprinted with the permission from ref. [11]. Copyright 2007 American
Chemical Society)
Fig. 9.7 (a) Schematic illustration of the “hydrothermal etching assisted crystallization” strategy
for the formation of the Fe 3 O 4 @titanate double-shelled yolk–shell microspheres. TEM images of a
single sphere synthesized at 150 C with hydrothermal treatment time: (b) 0 min, (c) 20 min, (d) 2 h,
(e) 12 h, and (f) 24 h (Reprinted with the permission from ref. [12]. Copyright 2011 American
Chemical Society)