

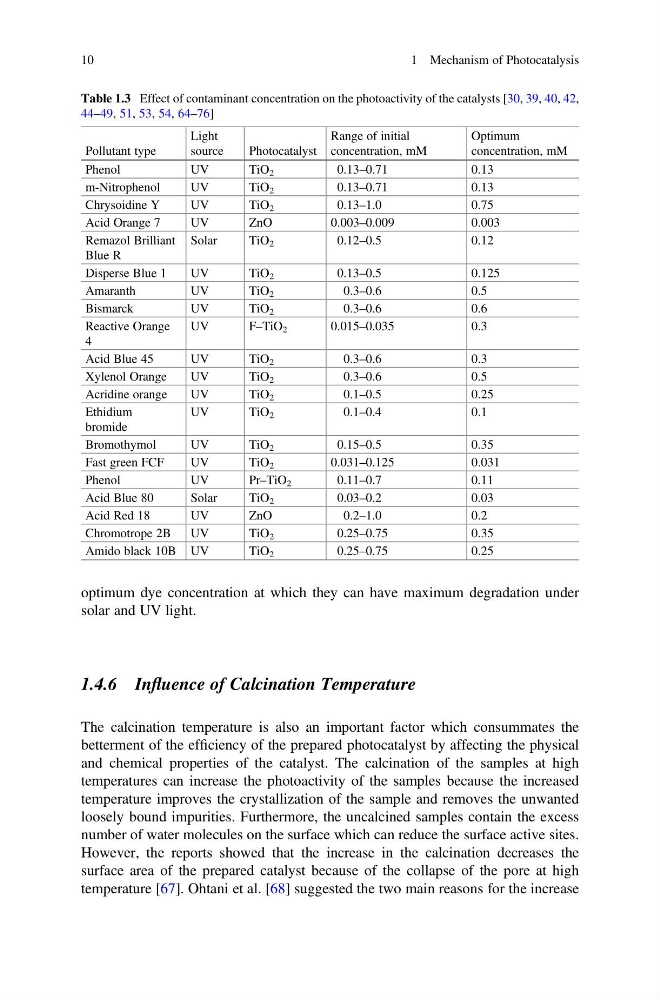
optimum dye concentration at which they can have maximum degradation under
solar and UV light.
1.4.6 Influence of Calcination Temperature
The calcination temperature is also an important factor which consummates the
betterment of the efficiency of the prepared photocatalyst by affecting the physical
and chemical properties of the catalyst. The calcination of the samples at high
temperatures can increase the photoactivity of the samples because the increased
temperature improves the crystallization of the sample and removes the unwanted
loosely bound impurities. Furthermore, the uncalcined samples contain the excess
number of water molecules on the surface which can reduce the surface active sites.
However, the reports showed that the increase in the calcination decreases the
surface area of the prepared catalyst because of the collapse of the pore at high
temperature [67]. Ohtani et al. [68] suggested the two main reasons for the increase
Table 1.3 Effect of contaminant concentration on the photoactivity of the catalysts [30, 39, 40, 42,
44–49, 51, 53, 54, 64–76]
Pollutant type
Light
source
Photocatalyst
Range of initial
concentration, mM
Optimum
concentration, mM
Phenol
UV
TiO 2
0.13–0.71
0.13
m-Nitrophenol
UV
TiO 2
0.13–0.71
0.13
Chrysoidine Y
UV
TiO 2
0.13–1.0
0.75
Acid Orange 7
UV
ZnO
0.003–0.009
0.003
Remazol Brilliant
Blue R
Solar
TiO 2
0.12–0.5
0.12
Disperse Blue 1
UV
TiO 2
0.13–0.5
0.125
Amaranth
UV
TiO 2
0.3–0.6
0.5
Bismarck
UV
TiO 2
0.3–0.6
0.6
Reactive Orange
4
UV
F–TiO 2
0.015–0.035
0.3
Acid Blue 45
UV
TiO 2
0.3–0.6
0.3
Xylenol Orange
UV
TiO 2
0.3–0.6
0.5
Acridine orange
UV
TiO 2
0.1–0.5
0.25
Ethidium
bromide
UV
TiO 2
0.1–0.4
0.1
Bromothymol
UV
TiO 2
0.15–0.5
0.35
Fast green FCF
UV
TiO 2
0.031–0.125
0.031
Phenol
UV
Pr–TiO 2
0.11–0.7
0.11
Acid Blue 80
Solar
TiO 2
0.03–0.2
0.03
Acid Red 18
UV
ZnO
0.2–1.0
0.2
Chromotrope 2B
UV
TiO 2
0.25–0.75
0.35
Amido black 10B UV
TiO 2
0.25–0.75
0.25
10
1 Mechanism of Photocatalysis
solar and UV light.
1.4.6 Influence of Calcination Temperature
The calcination temperature is also an important factor which consummates the
betterment of the efficiency of the prepared photocatalyst by affecting the physical
and chemical properties of the catalyst. The calcination of the samples at high
temperatures can increase the photoactivity of the samples because the increased
temperature improves the crystallization of the sample and removes the unwanted
loosely bound impurities. Furthermore, the uncalcined samples contain the excess
number of water molecules on the surface which can reduce the surface active sites.
However, the reports showed that the increase in the calcination decreases the
surface area of the prepared catalyst because of the collapse of the pore at high
temperature [67]. Ohtani et al. [68] suggested the two main reasons for the increase
Table 1.3 Effect of contaminant concentration on the photoactivity of the catalysts [30, 39, 40, 42,
44–49, 51, 53, 54, 64–76]
Pollutant type
Light
source
Photocatalyst
Range of initial
concentration, mM
Optimum
concentration, mM
Phenol
UV
TiO 2
0.13–0.71
0.13
m-Nitrophenol
UV
TiO 2
0.13–0.71
0.13
Chrysoidine Y
UV
TiO 2
0.13–1.0
0.75
Acid Orange 7
UV
ZnO
0.003–0.009
0.003
Remazol Brilliant
Blue R
Solar
TiO 2
0.12–0.5
0.12
Disperse Blue 1
UV
TiO 2
0.13–0.5
0.125
Amaranth
UV
TiO 2
0.3–0.6
0.5
Bismarck
UV
TiO 2
0.3–0.6
0.6
Reactive Orange
4
UV
F–TiO 2
0.015–0.035
0.3
Acid Blue 45
UV
TiO 2
0.3–0.6
0.3
Xylenol Orange
UV
TiO 2
0.3–0.6
0.5
Acridine orange
UV
TiO 2
0.1–0.5
0.25
Ethidium
bromide
UV
TiO 2
0.1–0.4
0.1
Bromothymol
UV
TiO 2
0.15–0.5
0.35
Fast green FCF
UV
TiO 2
0.031–0.125
0.031
Phenol
UV
Pr–TiO 2
0.11–0.7
0.11
Acid Blue 80
Solar
TiO 2
0.03–0.2
0.03
Acid Red 18
UV
ZnO
0.2–1.0
0.2
Chromotrope 2B
UV
TiO 2
0.25–0.75
0.35
Amido black 10B UV
TiO 2
0.25–0.75
0.25
10
1 Mechanism of Photocatalysis