

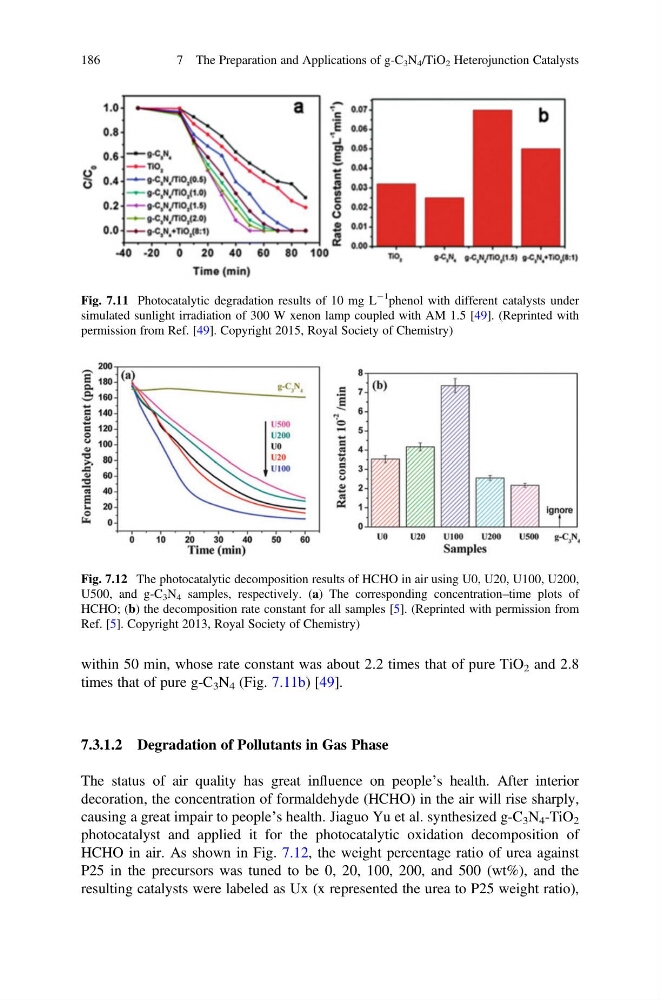
within 50 min, whose rate constant was about 2.2 times that of pure TiO 2 and 2.8
times that of pure g-C 3 N 4 (Fig. 7.11b) [49].
7.3.1.2 Degradation of Pollutants in Gas Phase
The status of air quality has great influence on people’s health. After interior
decoration, the concentration of formaldehyde (HCHO) in the air will rise sharply,
causing a great impair to people’s health. Jiaguo Yu et al. synthesized g-C 3 N 4 -TiO 2
photocatalyst and applied it for the photocatalytic oxidation decomposition of
HCHO in air. As shown in Fig. 7.12, the weight percentage ratio of urea against
P25 in the precursors was tuned to be 0, 20, 100, 200, and 500 (wt%), and the
resulting catalysts were labeled as Ux (x represented the urea to P25 weight ratio),
Fig. 7.11 Photocatalytic degradation results of 10 mg L
À1
phenol with different catalysts under
simulated sunlight irradiation of 300 W xenon lamp coupled with AM 1.5 [49]. (Reprinted with
permission from Ref. [49]. Copyright 2015, Royal Society of Chemistry)
Fig. 7.12 The photocatalytic decomposition results of HCHO in air using U0, U20, U100, U200,
U500, and g-C 3 N 4 samples, respectively. (a) The corresponding concentration–time plots of
HCHO; (b) the decomposition rate constant for all samples [5]. (Reprinted with permission from
Ref. [5]. Copyright 2013, Royal Society of Chemistry)
186
7 The Preparation and Applications of g-C 3 N 4 /TiO 2 Heterojunction Catalysts
times that of pure g-C 3 N 4 (Fig. 7.11b) [49].
7.3.1.2 Degradation of Pollutants in Gas Phase
The status of air quality has great influence on people’s health. After interior
decoration, the concentration of formaldehyde (HCHO) in the air will rise sharply,
causing a great impair to people’s health. Jiaguo Yu et al. synthesized g-C 3 N 4 -TiO 2
photocatalyst and applied it for the photocatalytic oxidation decomposition of
HCHO in air. As shown in Fig. 7.12, the weight percentage ratio of urea against
P25 in the precursors was tuned to be 0, 20, 100, 200, and 500 (wt%), and the
resulting catalysts were labeled as Ux (x represented the urea to P25 weight ratio),
Fig. 7.11 Photocatalytic degradation results of 10 mg L
À1
phenol with different catalysts under
simulated sunlight irradiation of 300 W xenon lamp coupled with AM 1.5 [49]. (Reprinted with
permission from Ref. [49]. Copyright 2015, Royal Society of Chemistry)
Fig. 7.12 The photocatalytic decomposition results of HCHO in air using U0, U20, U100, U200,
U500, and g-C 3 N 4 samples, respectively. (a) The corresponding concentration–time plots of
HCHO; (b) the decomposition rate constant for all samples [5]. (Reprinted with permission from
Ref. [5]. Copyright 2013, Royal Society of Chemistry)
186
7 The Preparation and Applications of g-C 3 N 4 /TiO 2 Heterojunction Catalysts