

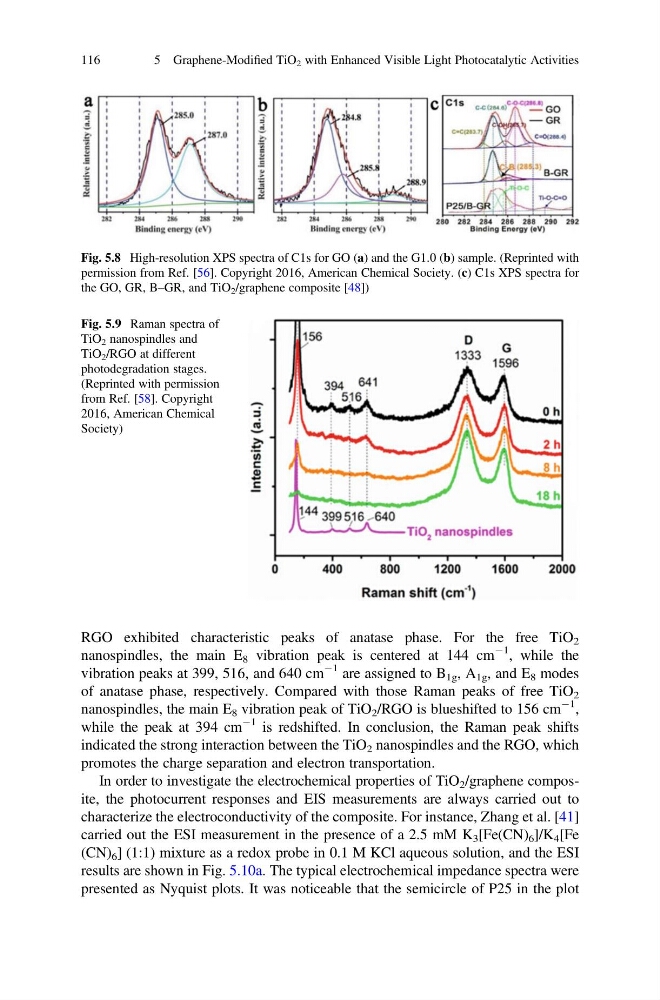
RGO exhibited characteristic peaks of anatase phase. For the free TiO 2
nanospindles, the main E 8 vibration peak is centered at 144 cm
À1 , while the
vibration peaks at 399, 516, and 640 cm
À1 are assigned to B 1g , A 1g , and E 8 modes
of anatase phase, respectively. Compared with those Raman peaks of free TiO 2
nanospindles, the main E 8 vibration peak of TiO 2 /RGO is blueshifted to 156 cm
À1 ,
while the peak at 394 cm
À1 is redshifted. In conclusion, the Raman peak shifts
indicated the strong interaction between the TiO 2 nanospindles and the RGO, which
promotes the charge separation and electron transportation.
In order to investigate the electrochemical properties of TiO 2 /graphene composite, the photocurrent responses and EIS measurements are always carried out to
characterize the electroconductivity of the composite. For instance, Zhang et al. [41]
carried out the ESI measurement in the presence of a 2.5 mM K 3 [Fe(CN) 6 ]/K 4 [Fe
(CN) 6 ] (1:1) mixture as a redox probe in 0.1 M KCl aqueous solution, and the ESI
results are shown in Fig. 5.10a. The typical electrochemical impedance spectra were
presented as Nyquist plots. It was noticeable that the semicircle of P25 in the plot
Fig. 5.8 High-resolution XPS spectra of C1s for GO (a) and the G1.0 (b) sample. (Reprinted with
permission from Ref. [56]. Copyright 2016, American Chemical Society. (c) C1s XPS spectra for
the GO, GR, B–GR, and TiO 2 /graphene composite [48])
Fig. 5.9 Raman spectra of
TiO 2 nanospindles and
TiO 2 /RGO at different
photodegradation stages.
(Reprinted with permission
from Ref. [58]. Copyright
2016, American Chemical
Society)
116
5 Graphene-Modified TiO 2 with Enhanced Visible Light Photocatalytic Activities
nanospindles, the main E 8 vibration peak is centered at 144 cm
À1 , while the
vibration peaks at 399, 516, and 640 cm
À1 are assigned to B 1g , A 1g , and E 8 modes
of anatase phase, respectively. Compared with those Raman peaks of free TiO 2
nanospindles, the main E 8 vibration peak of TiO 2 /RGO is blueshifted to 156 cm
À1 ,
while the peak at 394 cm
À1 is redshifted. In conclusion, the Raman peak shifts
indicated the strong interaction between the TiO 2 nanospindles and the RGO, which
promotes the charge separation and electron transportation.
In order to investigate the electrochemical properties of TiO 2 /graphene composite, the photocurrent responses and EIS measurements are always carried out to
characterize the electroconductivity of the composite. For instance, Zhang et al. [41]
carried out the ESI measurement in the presence of a 2.5 mM K 3 [Fe(CN) 6 ]/K 4 [Fe
(CN) 6 ] (1:1) mixture as a redox probe in 0.1 M KCl aqueous solution, and the ESI
results are shown in Fig. 5.10a. The typical electrochemical impedance spectra were
presented as Nyquist plots. It was noticeable that the semicircle of P25 in the plot
Fig. 5.8 High-resolution XPS spectra of C1s for GO (a) and the G1.0 (b) sample. (Reprinted with
permission from Ref. [56]. Copyright 2016, American Chemical Society. (c) C1s XPS spectra for
the GO, GR, B–GR, and TiO 2 /graphene composite [48])
Fig. 5.9 Raman spectra of
TiO 2 nanospindles and
TiO 2 /RGO at different
photodegradation stages.
(Reprinted with permission
from Ref. [58]. Copyright
2016, American Chemical
Society)
116
5 Graphene-Modified TiO 2 with Enhanced Visible Light Photocatalytic Activities