

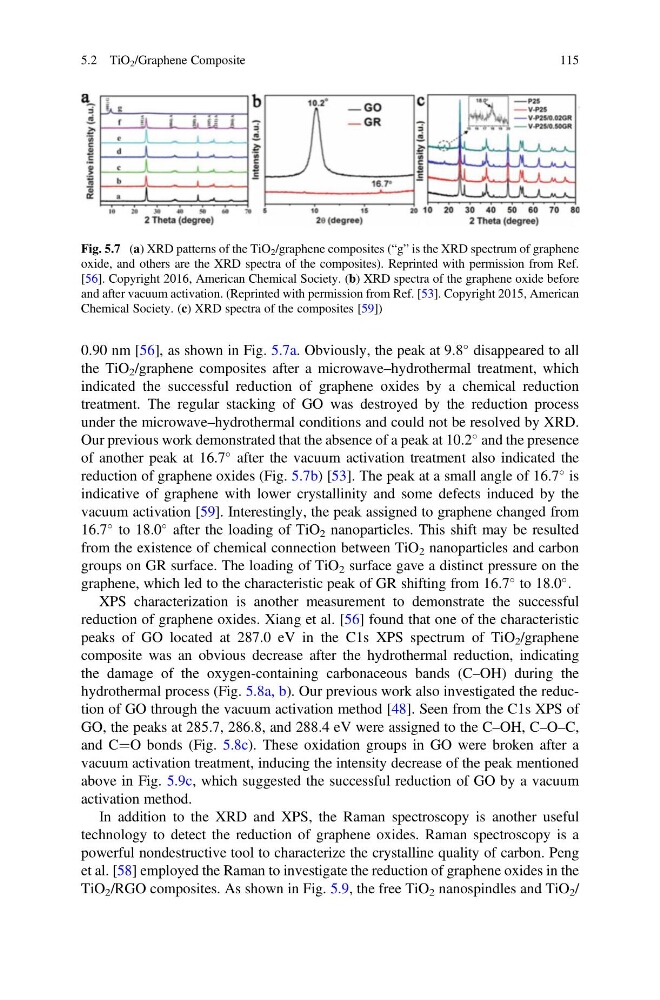
0.90 nm [56], as shown in Fig. 5.7a. Obviously, the peak at 9.8
disappeared to all
the TiO 2 /graphene composites after a microwave–hydrothermal treatment, which
indicated the successful reduction of graphene oxides by a chemical reduction
treatment. The regular stacking of GO was destroyed by the reduction process
under the microwave–hydrothermal conditions and could not be resolved by XRD.
Our previous work demonstrated that the absence of a peak at 10.2
and the presence
of another peak at 16.7
after the vacuum activation treatment also indicated the
reduction of graphene oxides (Fig. 5.7b) [53]. The peak at a small angle of 16.7
is
indicative of graphene with lower crystallinity and some defects induced by the
vacuum activation [59]. Interestingly, the peak assigned to graphene changed from
16.7
to 18.0
after the loading of TiO 2 nanoparticles. This shift may be resulted
from the existence of chemical connection between TiO 2 nanoparticles and carbon
groups on GR surface. The loading of TiO 2 surface gave a distinct pressure on the
graphene, which led to the characteristic peak of GR shifting from 16.7
to 18.0
.
XPS characterization is another measurement to demonstrate the successful
reduction of graphene oxides. Xiang et al. [56] found that one of the characteristic
peaks of GO located at 287.0 eV in the C1s XPS spectrum of TiO 2 /graphene
composite was an obvious decrease after the hydrothermal reduction, indicating
the damage of the oxygen-containing carbonaceous bands (C–OH) during the
hydrothermal process (Fig. 5.8a, b). Our previous work also investigated the reduction of GO through the vacuum activation method [48]. Seen from the C1s XPS of
GO, the peaks at 285.7, 286.8, and 288.4 eV were assigned to the C–OH, C–O–C,
and C¼O bonds (Fig. 5.8c). These oxidation groups in GO were broken after a
vacuum activation treatment, inducing the intensity decrease of the peak mentioned
above in Fig. 5.9c, which suggested the successful reduction of GO by a vacuum
activation method.
In addition to the XRD and XPS, the Raman spectroscopy is another useful
technology to detect the reduction of graphene oxides. Raman spectroscopy is a
powerful nondestructive tool to characterize the crystalline quality of carbon. Peng
et al. [58] employed the Raman to investigate the reduction of graphene oxides in the
TiO 2 /RGO composites. As shown in Fig. 5.9, the free TiO 2 nanospindles and TiO 2 /
Fig. 5.7 (a) XRD patterns of the TiO 2 /graphene composites (“g” is the XRD spectrum of graphene
oxide, and others are the XRD spectra of the composites). Reprinted with permission from Ref.
[56]. Copyright 2016, American Chemical Society. (b) XRD spectra of the graphene oxide before
and after vacuum activation. (Reprinted with permission from Ref. [53]. Copyright 2015, American
Chemical Society. (c) XRD spectra of the composites [59])
5.2 TiO 2 /Graphene Composite
115
disappeared to all
the TiO 2 /graphene composites after a microwave–hydrothermal treatment, which
indicated the successful reduction of graphene oxides by a chemical reduction
treatment. The regular stacking of GO was destroyed by the reduction process
under the microwave–hydrothermal conditions and could not be resolved by XRD.
Our previous work demonstrated that the absence of a peak at 10.2
and the presence
of another peak at 16.7
after the vacuum activation treatment also indicated the
reduction of graphene oxides (Fig. 5.7b) [53]. The peak at a small angle of 16.7
is
indicative of graphene with lower crystallinity and some defects induced by the
vacuum activation [59]. Interestingly, the peak assigned to graphene changed from
16.7
to 18.0
after the loading of TiO 2 nanoparticles. This shift may be resulted
from the existence of chemical connection between TiO 2 nanoparticles and carbon
groups on GR surface. The loading of TiO 2 surface gave a distinct pressure on the
graphene, which led to the characteristic peak of GR shifting from 16.7
to 18.0
.
XPS characterization is another measurement to demonstrate the successful
reduction of graphene oxides. Xiang et al. [56] found that one of the characteristic
peaks of GO located at 287.0 eV in the C1s XPS spectrum of TiO 2 /graphene
composite was an obvious decrease after the hydrothermal reduction, indicating
the damage of the oxygen-containing carbonaceous bands (C–OH) during the
hydrothermal process (Fig. 5.8a, b). Our previous work also investigated the reduction of GO through the vacuum activation method [48]. Seen from the C1s XPS of
GO, the peaks at 285.7, 286.8, and 288.4 eV were assigned to the C–OH, C–O–C,
and C¼O bonds (Fig. 5.8c). These oxidation groups in GO were broken after a
vacuum activation treatment, inducing the intensity decrease of the peak mentioned
above in Fig. 5.9c, which suggested the successful reduction of GO by a vacuum
activation method.
In addition to the XRD and XPS, the Raman spectroscopy is another useful
technology to detect the reduction of graphene oxides. Raman spectroscopy is a
powerful nondestructive tool to characterize the crystalline quality of carbon. Peng
et al. [58] employed the Raman to investigate the reduction of graphene oxides in the
TiO 2 /RGO composites. As shown in Fig. 5.9, the free TiO 2 nanospindles and TiO 2 /
Fig. 5.7 (a) XRD patterns of the TiO 2 /graphene composites (“g” is the XRD spectrum of graphene
oxide, and others are the XRD spectra of the composites). Reprinted with permission from Ref.
[56]. Copyright 2016, American Chemical Society. (b) XRD spectra of the graphene oxide before
and after vacuum activation. (Reprinted with permission from Ref. [53]. Copyright 2015, American
Chemical Society. (c) XRD spectra of the composites [59])
5.2 TiO 2 /Graphene Composite
115