

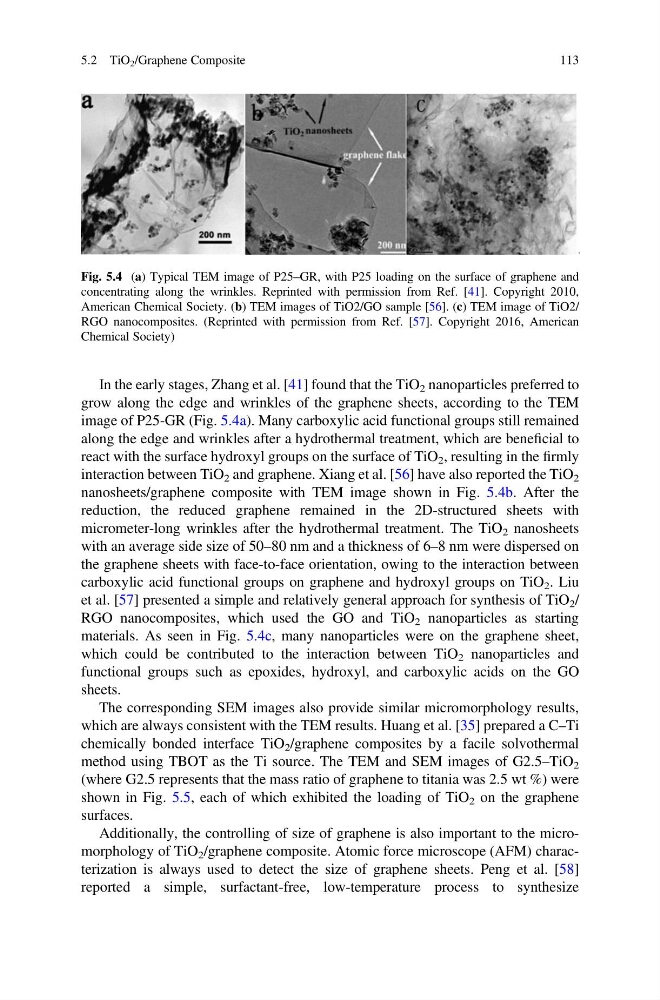
In the early stages, Zhang et al. [41] found that the TiO 2 nanoparticles preferred to
grow along the edge and wrinkles of the graphene sheets, according to the TEM
image of P25-GR (Fig. 5.4a). Many carboxylic acid functional groups still remained
along the edge and wrinkles after a hydrothermal treatment, which are beneficial to
react with the surface hydroxyl groups on the surface of TiO 2 , resulting in the firmly
interaction between TiO 2 and graphene. Xiang et al. [56] have also reported the TiO 2
nanosheets/graphene composite with TEM image shown in Fig. 5.4b. After the
reduction, the reduced graphene remained in the 2D-structured sheets with
micrometer-long wrinkles after the hydrothermal treatment. The TiO 2 nanosheets
with an average side size of 50–80 nm and a thickness of 6–8 nm were dispersed on
the graphene sheets with face-to-face orientation, owing to the interaction between
carboxylic acid functional groups on graphene and hydroxyl groups on TiO 2 . Liu
et al. [57] presented a simple and relatively general approach for synthesis of TiO 2 /
RGO nanocomposites, which used the GO and TiO 2 nanoparticles as starting
materials. As seen in Fig. 5.4c, many nanoparticles were on the graphene sheet,
which could be contributed to the interaction between TiO 2 nanoparticles and
functional groups such as epoxides, hydroxyl, and carboxylic acids on the GO
sheets.
The corresponding SEM images also provide similar micromorphology results,
which are always consistent with the TEM results. Huang et al. [35] prepared a C–Ti
chemically bonded interface TiO 2 /graphene composites by a facile solvothermal
method using TBOT as the Ti source. The TEM and SEM images of G2.5–TiO 2
(where G2.5 represents that the mass ratio of graphene to titania was 2.5 wt %) were
shown in Fig. 5.5, each of which exhibited the loading of TiO 2 on the graphene
surfaces.
Additionally, the controlling of size of graphene is also important to the micromorphology of TiO 2 /graphene composite. Atomic force microscope (AFM) characterization is always used to detect the size of graphene sheets. Peng et al. [58]
reported a simple, surfactant-free, low-temperature process to synthesize
Fig. 5.4 (a) Typical TEM image of P25–GR, with P25 loading on the surface of graphene and
concentrating along the wrinkles. Reprinted with permission from Ref. [41]. Copyright 2010,
American Chemical Society. (b) TEM images of TiO2/GO sample [56]. (c) TEM image of TiO2/
RGO nanocomposites. (Reprinted with permission from Ref. [57]. Copyright 2016, American
Chemical Society)
5.2 TiO 2 /Graphene Composite
113
grow along the edge and wrinkles of the graphene sheets, according to the TEM
image of P25-GR (Fig. 5.4a). Many carboxylic acid functional groups still remained
along the edge and wrinkles after a hydrothermal treatment, which are beneficial to
react with the surface hydroxyl groups on the surface of TiO 2 , resulting in the firmly
interaction between TiO 2 and graphene. Xiang et al. [56] have also reported the TiO 2
nanosheets/graphene composite with TEM image shown in Fig. 5.4b. After the
reduction, the reduced graphene remained in the 2D-structured sheets with
micrometer-long wrinkles after the hydrothermal treatment. The TiO 2 nanosheets
with an average side size of 50–80 nm and a thickness of 6–8 nm were dispersed on
the graphene sheets with face-to-face orientation, owing to the interaction between
carboxylic acid functional groups on graphene and hydroxyl groups on TiO 2 . Liu
et al. [57] presented a simple and relatively general approach for synthesis of TiO 2 /
RGO nanocomposites, which used the GO and TiO 2 nanoparticles as starting
materials. As seen in Fig. 5.4c, many nanoparticles were on the graphene sheet,
which could be contributed to the interaction between TiO 2 nanoparticles and
functional groups such as epoxides, hydroxyl, and carboxylic acids on the GO
sheets.
The corresponding SEM images also provide similar micromorphology results,
which are always consistent with the TEM results. Huang et al. [35] prepared a C–Ti
chemically bonded interface TiO 2 /graphene composites by a facile solvothermal
method using TBOT as the Ti source. The TEM and SEM images of G2.5–TiO 2
(where G2.5 represents that the mass ratio of graphene to titania was 2.5 wt %) were
shown in Fig. 5.5, each of which exhibited the loading of TiO 2 on the graphene
surfaces.
Additionally, the controlling of size of graphene is also important to the micromorphology of TiO 2 /graphene composite. Atomic force microscope (AFM) characterization is always used to detect the size of graphene sheets. Peng et al. [58]
reported a simple, surfactant-free, low-temperature process to synthesize
Fig. 5.4 (a) Typical TEM image of P25–GR, with P25 loading on the surface of graphene and
concentrating along the wrinkles. Reprinted with permission from Ref. [41]. Copyright 2010,
American Chemical Society. (b) TEM images of TiO2/GO sample [56]. (c) TEM image of TiO2/
RGO nanocomposites. (Reprinted with permission from Ref. [57]. Copyright 2016, American
Chemical Society)
5.2 TiO 2 /Graphene Composite
113