

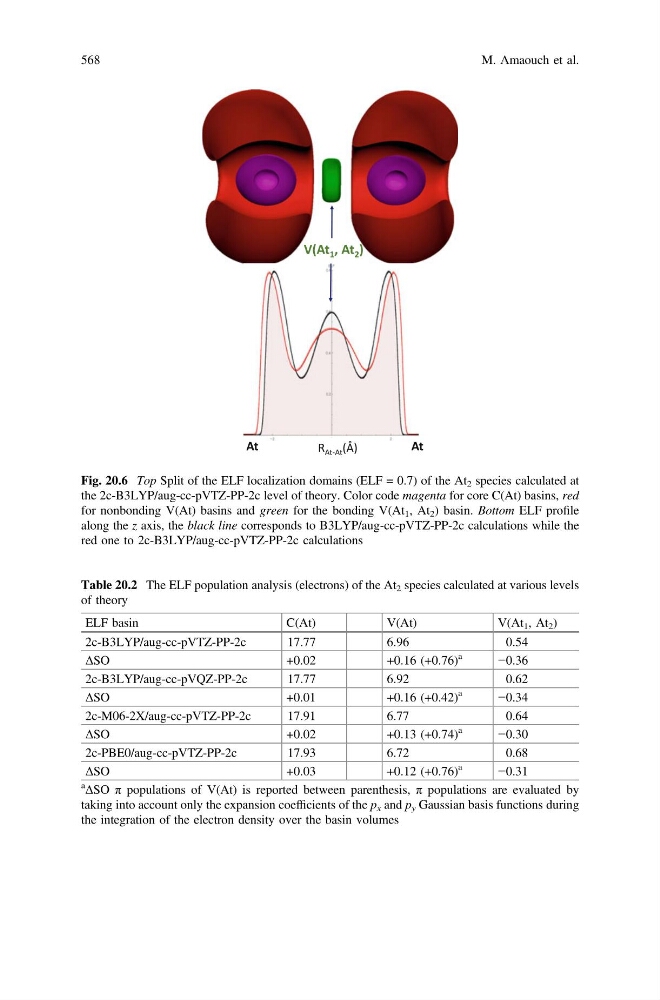
Fig. 20.6 Top Split of the ELF localization domains (ELF = 0.7) of the At 2 species calculated at
the 2c-B3LYP/aug-cc-pVTZ-PP-2c level of theory. Color code magenta for core C(At) basins, red
for nonbonding V(At) basins and green for the bonding V(At 1 , At 2 ) basin. Bottom ELF profile
along the z axis, the black line corresponds to B3LYP/aug-cc-pVTZ-PP-2c calculations while the
red one to 2c-B3LYP/aug-cc-pVTZ-PP-2c calculations
Table 20.2 The ELF population analysis (electrons) of the At 2 species calculated at various levels
of theory
ELF basin
C(At)
V(At)
V(At 1 , At 2 )
2c-B3LYP/aug-cc-pVTZ-PP-2c
17.77
6.96
0.54
ΔSO
+0.02
+0.16 (+0.76)
a
−0.36
2c-B3LYP/aug-cc-pVQZ-PP-2c
17.77
6.92
0.62
ΔSO
+0.01
+0.16 (+0.42)
a
−0.34
2c-M06-2X/aug-cc-pVTZ-PP-2c
17.91
6.77
0.64
ΔSO
+0.02
+0.13 (+0.74)
a
−0.30
2c-PBE0/aug-cc-pVTZ-PP-2c
17.93
6.72
0.68
ΔSO
+0.03
+0.12 (+0.76)
a
−0.31
a ΔSO π populations of V(At) is reported between parenthesis, π populations are evaluated by
taking into account only the expansion coefficients of the p x and p y Gaussian basis functions during
the integration of the electron density over the basin volumes
568
M. Amaouch et al.
the 2c-B3LYP/aug-cc-pVTZ-PP-2c level of theory. Color code magenta for core C(At) basins, red
for nonbonding V(At) basins and green for the bonding V(At 1 , At 2 ) basin. Bottom ELF profile
along the z axis, the black line corresponds to B3LYP/aug-cc-pVTZ-PP-2c calculations while the
red one to 2c-B3LYP/aug-cc-pVTZ-PP-2c calculations
Table 20.2 The ELF population analysis (electrons) of the At 2 species calculated at various levels
of theory
ELF basin
C(At)
V(At)
V(At 1 , At 2 )
2c-B3LYP/aug-cc-pVTZ-PP-2c
17.77
6.96
0.54
ΔSO
+0.02
+0.16 (+0.76)
a
−0.36
2c-B3LYP/aug-cc-pVQZ-PP-2c
17.77
6.92
0.62
ΔSO
+0.01
+0.16 (+0.42)
a
−0.34
2c-M06-2X/aug-cc-pVTZ-PP-2c
17.91
6.77
0.64
ΔSO
+0.02
+0.13 (+0.74)
a
−0.30
2c-PBE0/aug-cc-pVTZ-PP-2c
17.93
6.72
0.68
ΔSO
+0.03
+0.12 (+0.76)
a
−0.31
a ΔSO π populations of V(At) is reported between parenthesis, π populations are evaluated by
taking into account only the expansion coefficients of the p x and p y Gaussian basis functions during
the integration of the electron density over the basin volumes
568
M. Amaouch et al.