

20.2.2 Sketch of the QTAIM Analysis
Of all the possible ways to partition the electron density in a molecule [46, 47], the
QTAIM theory [3, 18] is probably the most used for discussing the nature of
chemical bonding in molecules and solids. The pioneering works due to Bader and
coworkers in the 70s [48–50] were motived by the generalization of the quantum
mechanical principle of stationary action to a molecular subsystem. Based on the
theory of gradient dynamical systems [51, 52], they have led to an original topological partition of the electron density (so-called virial partitioning) into
non-overlapping atomic regions [48, 50, 53]. These regions are termed atomic
basins (noted Ω) and are stable manifolds of the attractors (maxima) of the density.
Then, topological atoms can be defined as the union of a nucleus and of its atomic
basin. However, non-nuclear attractors (flat maxima) can be exceptionally found in
internuclear regions of metal clusters [54]. Interestingly, the QTAIM approach can
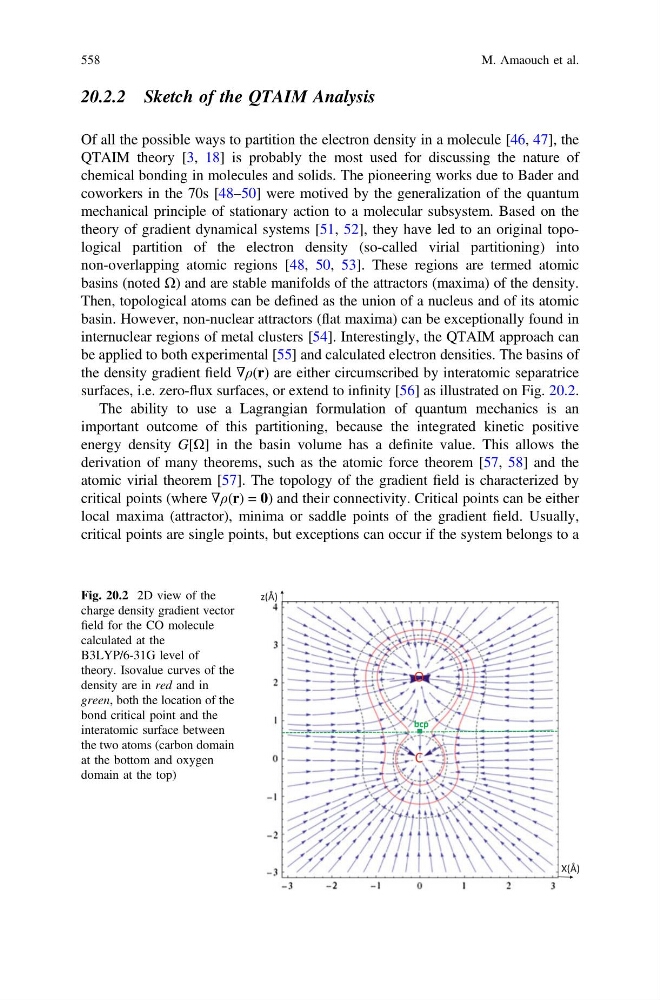
be applied to both experimental [55] and calculated electron densities. The basins of
the density gradient field ∇ρ(r) are either circumscribed by interatomic separatrice
surfaces, i.e. zero-flux surfaces, or extend to infinity [56] as illustrated on Fig. 20.2.
The ability to use a Lagrangian formulation of quantum mechanics is an
important outcome of this partitioning, because the integrated kinetic positive
energy density G[Ω] in the basin volume has a definite value. This allows the
derivation of many theorems, such as the atomic force theorem [57, 58] and the
atomic virial theorem [57]. The topology of the gradient field is characterized by
critical points (where ∇ρ(r) = 0) and their connectivity. Critical points can be either
local maxima (attractor), minima or saddle points of the gradient field. Usually,
critical points are single points, but exceptions can occur if the system belongs to a
Fig. 20.2 2D view of the
charge density gradient vector
field for the CO molecule
calculated at the
B3LYP/6-31G level of
theory. Isovalue curves of the
density are in red and in
green, both the location of the
bond critical point and the
interatomic surface between
the two atoms (carbon domain
at the bottom and oxygen
domain at the top)
558
M. Amaouch et al.
Of all the possible ways to partition the electron density in a molecule [46, 47], the
QTAIM theory [3, 18] is probably the most used for discussing the nature of
chemical bonding in molecules and solids. The pioneering works due to Bader and
coworkers in the 70s [48–50] were motived by the generalization of the quantum
mechanical principle of stationary action to a molecular subsystem. Based on the
theory of gradient dynamical systems [51, 52], they have led to an original topological partition of the electron density (so-called virial partitioning) into
non-overlapping atomic regions [48, 50, 53]. These regions are termed atomic
basins (noted Ω) and are stable manifolds of the attractors (maxima) of the density.
Then, topological atoms can be defined as the union of a nucleus and of its atomic
basin. However, non-nuclear attractors (flat maxima) can be exceptionally found in
internuclear regions of metal clusters [54]. Interestingly, the QTAIM approach can
be applied to both experimental [55] and calculated electron densities. The basins of
the density gradient field ∇ρ(r) are either circumscribed by interatomic separatrice
surfaces, i.e. zero-flux surfaces, or extend to infinity [56] as illustrated on Fig. 20.2.
The ability to use a Lagrangian formulation of quantum mechanics is an
important outcome of this partitioning, because the integrated kinetic positive
energy density G[Ω] in the basin volume has a definite value. This allows the
derivation of many theorems, such as the atomic force theorem [57, 58] and the
atomic virial theorem [57]. The topology of the gradient field is characterized by
critical points (where ∇ρ(r) = 0) and their connectivity. Critical points can be either
local maxima (attractor), minima or saddle points of the gradient field. Usually,
critical points are single points, but exceptions can occur if the system belongs to a
Fig. 20.2 2D view of the
charge density gradient vector
field for the CO molecule
calculated at the
B3LYP/6-31G level of
theory. Isovalue curves of the
density are in red and in
green, both the location of the
bond critical point and the
interatomic surface between
the two atoms (carbon domain
at the bottom and oxygen
domain at the top)
558
M. Amaouch et al.