

that of graphite, with broad, low-density regions indicative of π-stacking between
base-steps. The interactions between individual deoxyadenosine-deoxythymidine
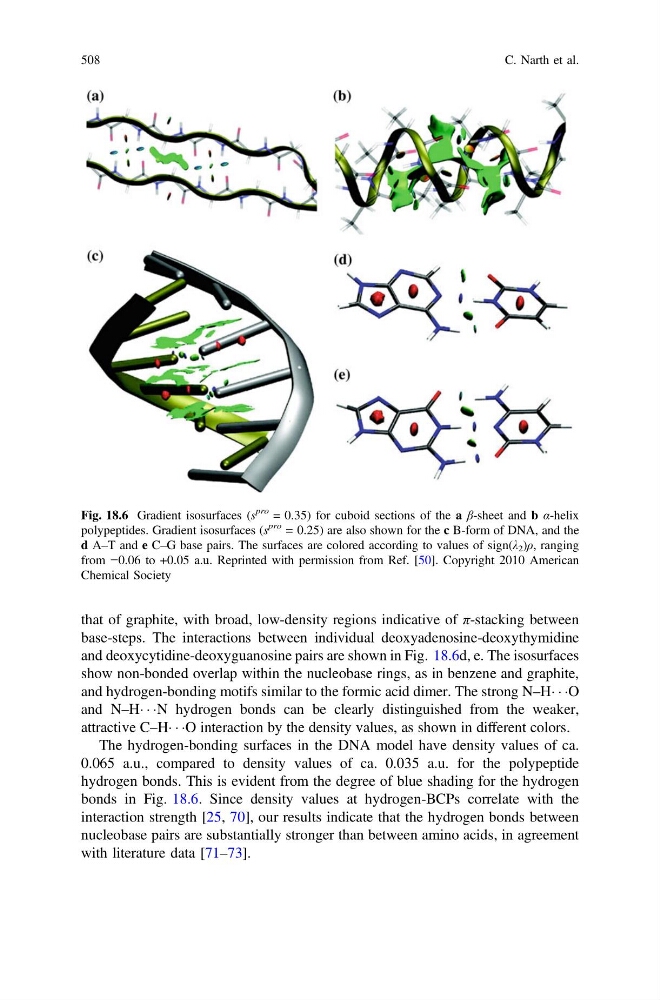
and deoxycytidine-deoxyguanosine pairs are shown in Fig. 18.6d, e. The isosurfaces
show non-bonded overlap within the nucleobase rings, as in benzene and graphite,
and hydrogen-bonding motifs similar to the formic acid dimer. The strong N–HÁ Á ÁO
and N–HÁ Á ÁN hydrogen bonds can be clearly distinguished from the weaker,
attractive C–HÁ Á ÁO interaction by the density values, as shown in different colors.
The hydrogen-bonding surfaces in the DNA model have density values of ca.
0.065 a.u., compared to density values of ca. 0.035 a.u. for the polypeptide
hydrogen bonds. This is evident from the degree of blue shading for the hydrogen
bonds in Fig. 18.6. Since density values at hydrogen-BCPs correlate with the
interaction strength [25, 70], our results indicate that the hydrogen bonds between
nucleobase pairs are substantially stronger than between amino acids, in agreement
with literature data [71–73].
Fig. 18.6 Gradient isosurfaces (s
pro = 0.35) for cuboid sections of the a β-sheet and b α-helix
polypeptides. Gradient isosurfaces (s
pro = 0.25) are also shown for the c B-form of DNA, and the
d A–T and e C–G base pairs. The surfaces are colored according to values of sign(λ 2 )ρ, ranging
from −0.06 to +0.05 a.u. Reprinted with permission from Ref. [50]. Copyright 2010 American
Chemical Society
508
C. Narth et al.
base-steps. The interactions between individual deoxyadenosine-deoxythymidine
and deoxycytidine-deoxyguanosine pairs are shown in Fig. 18.6d, e. The isosurfaces
show non-bonded overlap within the nucleobase rings, as in benzene and graphite,
and hydrogen-bonding motifs similar to the formic acid dimer. The strong N–HÁ Á ÁO
and N–HÁ Á ÁN hydrogen bonds can be clearly distinguished from the weaker,
attractive C–HÁ Á ÁO interaction by the density values, as shown in different colors.
The hydrogen-bonding surfaces in the DNA model have density values of ca.
0.065 a.u., compared to density values of ca. 0.035 a.u. for the polypeptide
hydrogen bonds. This is evident from the degree of blue shading for the hydrogen
bonds in Fig. 18.6. Since density values at hydrogen-BCPs correlate with the
interaction strength [25, 70], our results indicate that the hydrogen bonds between
nucleobase pairs are substantially stronger than between amino acids, in agreement
with literature data [71–73].
Fig. 18.6 Gradient isosurfaces (s
pro = 0.35) for cuboid sections of the a β-sheet and b α-helix
polypeptides. Gradient isosurfaces (s
pro = 0.25) are also shown for the c B-form of DNA, and the
d A–T and e C–G base pairs. The surfaces are colored according to values of sign(λ 2 )ρ, ranging
from −0.06 to +0.05 a.u. Reprinted with permission from Ref. [50]. Copyright 2010 American
Chemical Society
508
C. Narth et al.