

indicating that the CT component is smaller in F 2 Be:FCl:NCH than in F 2 Be:FCl:
NHCH 2 and F 2 Be:FCl:NH 3 . These latter show very similar curves all over the
molecular region. The total CT extracted at the isodensity boundary are 0.082 e,
0.101 e and 0.095 e, for N-base = NCH, NHCH 2 and NH 3 , respectively.
The CD functions associated to the formation of beryllium bond in the structure
obtained by removing the N-base fragment from the ternary complex are reported in
Fig. 17.13 as black, blue and red dotted lines for NCH, NHCH 2 and NH 3 ,
respectively. Therefore, the differences between the dotted lines are due to the
different geometry of each F 2 Be:FCl:N-base system, while the difference between a
solid and a dotted line of the same color can be used to estimate the net electronic
effect due to cooperativity, as we previously did in the case of F 2 Be:FCl:NCH. As
clearly emerges from the figure, the difference between solid and dotted lines
changes from color to color, indicating that different bases affect differently the
Be···F bond. In particular, the difference taken at the isodensity boundary is of
+0.041, +0.112 and +0.077, for the sp, sp 2 and sp 3 hybridized bases, respectively.
This shows that the cooperativity effect in enhancing the Be ← F CT strongly
depends even on the nature of the base.
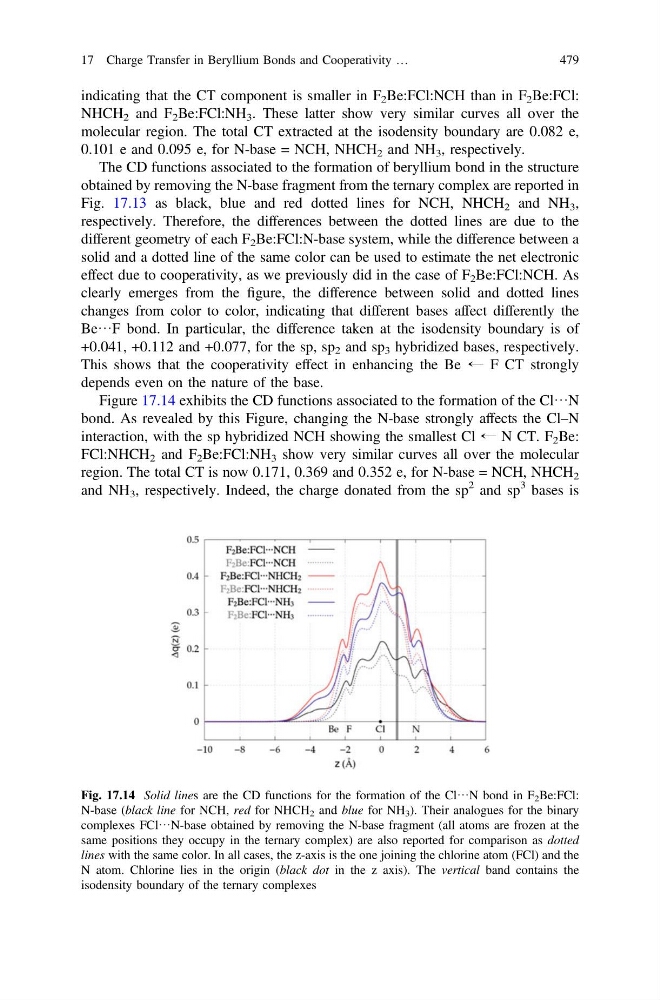
Figure 17.14 exhibits the CD functions associated to the formation of the Cl···N
bond. As revealed by this Figure, changing the N-base strongly affects the Cl–N
interaction, with the sp hybridized NCH showing the smallest Cl ← N CT. F 2 Be:
FCl:NHCH 2 and F 2 Be:FCl:NH 3 show very similar curves all over the molecular
region. The total CT is now 0.171, 0.369 and 0.352 e, for N-base = NCH, NHCH 2
and NH 3 , respectively. Indeed, the charge donated from the sp
2 and sp
3 bases is
Fig. 17.14 Solid lines are the CD functions for the formation of the Cl···N bond in F 2 Be:FCl:
N-base (black line for NCH, red for NHCH 2 and blue for NH 3 ). Their analogues for the binary
complexes FCl···N-base obtained by removing the N-base fragment (all atoms are frozen at the
same positions they occupy in the ternary complex) are also reported for comparison as dotted
lines with the same color. In all cases, the z-axis is the one joining the chlorine atom (FCl) and the
N atom. Chlorine lies in the origin (black dot in the z axis). The vertical band contains the
isodensity boundary of the ternary complexes
17 Charge Transfer in Beryllium Bonds and Cooperativity …
479
NHCH 2 and F 2 Be:FCl:NH 3 . These latter show very similar curves all over the
molecular region. The total CT extracted at the isodensity boundary are 0.082 e,
0.101 e and 0.095 e, for N-base = NCH, NHCH 2 and NH 3 , respectively.
The CD functions associated to the formation of beryllium bond in the structure
obtained by removing the N-base fragment from the ternary complex are reported in
Fig. 17.13 as black, blue and red dotted lines for NCH, NHCH 2 and NH 3 ,
respectively. Therefore, the differences between the dotted lines are due to the
different geometry of each F 2 Be:FCl:N-base system, while the difference between a
solid and a dotted line of the same color can be used to estimate the net electronic
effect due to cooperativity, as we previously did in the case of F 2 Be:FCl:NCH. As
clearly emerges from the figure, the difference between solid and dotted lines
changes from color to color, indicating that different bases affect differently the
Be···F bond. In particular, the difference taken at the isodensity boundary is of
+0.041, +0.112 and +0.077, for the sp, sp 2 and sp 3 hybridized bases, respectively.
This shows that the cooperativity effect in enhancing the Be ← F CT strongly
depends even on the nature of the base.
Figure 17.14 exhibits the CD functions associated to the formation of the Cl···N
bond. As revealed by this Figure, changing the N-base strongly affects the Cl–N
interaction, with the sp hybridized NCH showing the smallest Cl ← N CT. F 2 Be:
FCl:NHCH 2 and F 2 Be:FCl:NH 3 show very similar curves all over the molecular
region. The total CT is now 0.171, 0.369 and 0.352 e, for N-base = NCH, NHCH 2
and NH 3 , respectively. Indeed, the charge donated from the sp
2 and sp
3 bases is
Fig. 17.14 Solid lines are the CD functions for the formation of the Cl···N bond in F 2 Be:FCl:
N-base (black line for NCH, red for NHCH 2 and blue for NH 3 ). Their analogues for the binary
complexes FCl···N-base obtained by removing the N-base fragment (all atoms are frozen at the
same positions they occupy in the ternary complex) are also reported for comparison as dotted
lines with the same color. In all cases, the z-axis is the one joining the chlorine atom (FCl) and the
N atom. Chlorine lies in the origin (black dot in the z axis). The vertical band contains the
isodensity boundary of the ternary complexes
17 Charge Transfer in Beryllium Bonds and Cooperativity …
479