

As a standard, we use the value of the CD function at the point along the z-axis
where equal-valued isodensity surfaces of the isolated fragments become tangent
(vertical band in the Figures, see caption for details) to estimate the charge transfer
(CT) between the fragments. This indicates that the CT associated to the formation
of the Be···F bond is amplified through cooperative effect by 130 %, going from the
0.036 e transferred (Be ← F) in F 2 Be:FCl to the 0.082 e transferred in the ternary
F 2 Be:FCl:NCH complex.
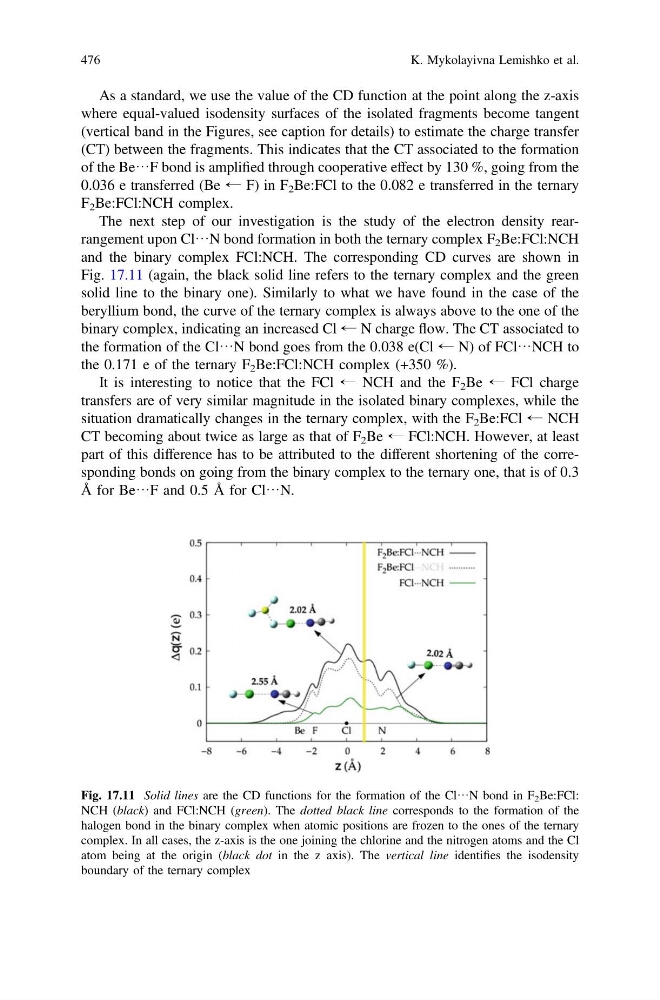
The next step of our investigation is the study of the electron density rearrangement upon Cl···N bond formation in both the ternary complex F 2 Be:FCl:NCH
and the binary complex FCl:NCH. The corresponding CD curves are shown in
Fig. 17.11 (again, the black solid line refers to the ternary complex and the green
solid line to the binary one). Similarly to what we have found in the case of the
beryllium bond, the curve of the ternary complex is always above to the one of the
binary complex, indicating an increased Cl ← N charge flow. The CT associated to
the formation of the Cl···N bond goes from the 0.038 e(Cl ← N) of FCl···NCH to
the 0.171 e of the ternary F 2 Be:FCl:NCH complex (+350 %).
It is interesting to notice that the FCl ← NCH and the F 2 Be ← FCl charge
transfers are of very similar magnitude in the isolated binary complexes, while the
situation dramatically changes in the ternary complex, with the F 2 Be:FCl ← NCH
CT becoming about twice as large as that of F 2 Be ← FCl:NCH. However, at least
part of this difference has to be attributed to the different shortening of the corresponding bonds on going from the binary complex to the ternary one, that is of 0.3
Å for Be···F and 0.5 Å for Cl···N.
Fig. 17.11 Solid lines are the CD functions for the formation of the Cl···N bond in F 2 Be:FCl:
NCH (black) and FCl:NCH (green). The dotted black line corresponds to the formation of the
halogen bond in the binary complex when atomic positions are frozen to the ones of the ternary
complex. In all cases, the z-axis is the one joining the chlorine and the nitrogen atoms and the Cl
atom being at the origin (black dot in the z axis). The vertical line identifies the isodensity
boundary of the ternary complex
476
K. Mykolayivna Lemishko et al.
where equal-valued isodensity surfaces of the isolated fragments become tangent
(vertical band in the Figures, see caption for details) to estimate the charge transfer
(CT) between the fragments. This indicates that the CT associated to the formation
of the Be···F bond is amplified through cooperative effect by 130 %, going from the
0.036 e transferred (Be ← F) in F 2 Be:FCl to the 0.082 e transferred in the ternary
F 2 Be:FCl:NCH complex.
The next step of our investigation is the study of the electron density rearrangement upon Cl···N bond formation in both the ternary complex F 2 Be:FCl:NCH
and the binary complex FCl:NCH. The corresponding CD curves are shown in
Fig. 17.11 (again, the black solid line refers to the ternary complex and the green
solid line to the binary one). Similarly to what we have found in the case of the
beryllium bond, the curve of the ternary complex is always above to the one of the
binary complex, indicating an increased Cl ← N charge flow. The CT associated to
the formation of the Cl···N bond goes from the 0.038 e(Cl ← N) of FCl···NCH to
the 0.171 e of the ternary F 2 Be:FCl:NCH complex (+350 %).
It is interesting to notice that the FCl ← NCH and the F 2 Be ← FCl charge
transfers are of very similar magnitude in the isolated binary complexes, while the
situation dramatically changes in the ternary complex, with the F 2 Be:FCl ← NCH
CT becoming about twice as large as that of F 2 Be ← FCl:NCH. However, at least
part of this difference has to be attributed to the different shortening of the corresponding bonds on going from the binary complex to the ternary one, that is of 0.3
Å for Be···F and 0.5 Å for Cl···N.
Fig. 17.11 Solid lines are the CD functions for the formation of the Cl···N bond in F 2 Be:FCl:
NCH (black) and FCl:NCH (green). The dotted black line corresponds to the formation of the
halogen bond in the binary complex when atomic positions are frozen to the ones of the ternary
complex. In all cases, the z-axis is the one joining the chlorine and the nitrogen atoms and the Cl
atom being at the origin (black dot in the z axis). The vertical line identifies the isodensity
boundary of the ternary complex
476
K. Mykolayivna Lemishko et al.