

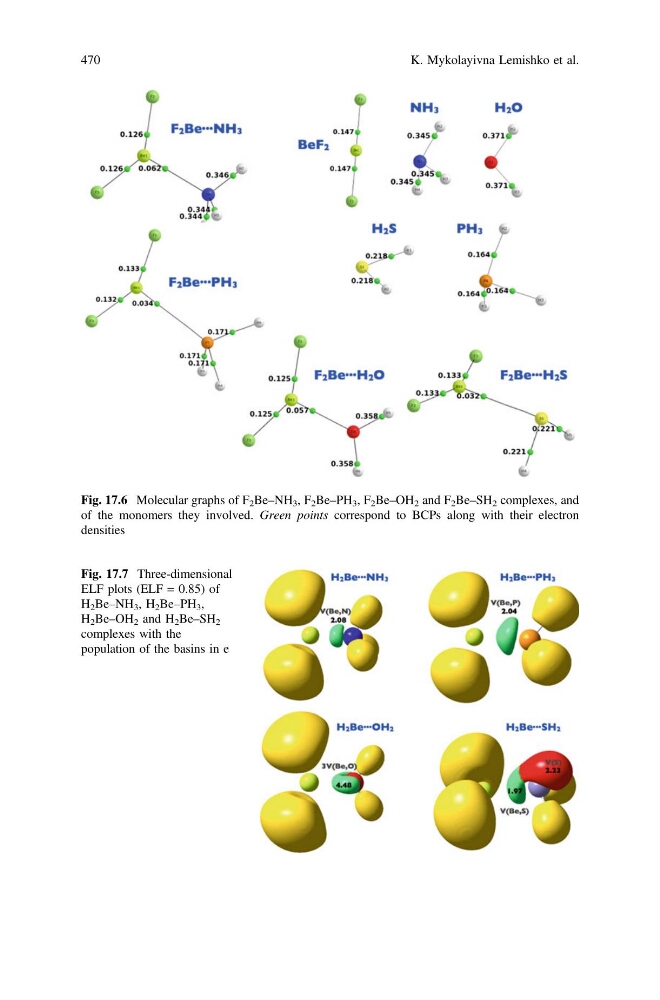
Fig. 17.6 Molecular graphs of F 2 Be–NH 3 , F 2 Be–PH 3 , F 2 Be–OH 2 and F 2 Be–SH 2 complexes, and
of the monomers they involved. Green points correspond to BCPs along with their electron
densities
Fig. 17.7 Three-dimensional
ELF plots (ELF = 0.85) of
H 2 Be–NH 3 , H 2 Be–PH 3 ,
H 2 Be–OH 2 and H 2 Be–SH 2
complexes with the
population of the basins in e
470
K. Mykolayivna Lemishko et al.
of the monomers they involved. Green points correspond to BCPs along with their electron
densities
Fig. 17.7 Three-dimensional
ELF plots (ELF = 0.85) of
H 2 Be–NH 3 , H 2 Be–PH 3 ,
H 2 Be–OH 2 and H 2 Be–SH 2
complexes with the
population of the basins in e
470
K. Mykolayivna Lemishko et al.