

Interestingly, the QTAIM comparison (Figs. 17.5 and 17.6) between beryllium
bonds is less straightforward. Electron density values at the BCPs are of course
significantly higher in NH 3 and H 2 O complexes than in the PH 3 or SH 2 ones,
because in the latter case more voluminous second-row atoms are involved, so no
direct conclusions can be extracted from these facts with respect to the strength of
the beryllium bond. It should be noted, however that very similar values are found
if we compare BeH 2 /BeF 2 results: 0.061/0.062 (NH 3 ), 0.037/0.034 (PH 3 ),
0.055/0.057 (H 2 O) and 0.034/0.032 (H 2 S), showing that the strength of the
beryllium bond is not necessarily smaller when BeF 2 is involved. Further information can be obtained when looking at the laplacian of the electron density (∇
2
ρ)
as Eskandari did studying our set of complexes [103]. The L-function, defined as
the negative of ∇
2
ρ, presents positive values in regions of charge concentration
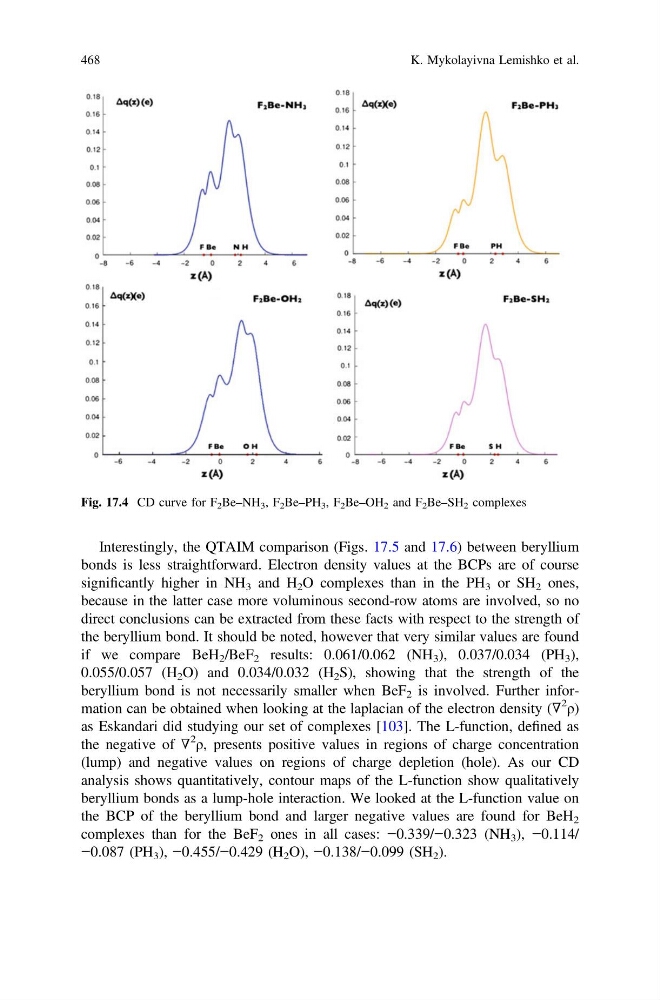
(lump) and negative values on regions of charge depletion (hole). As our CD
analysis shows quantitatively, contour maps of the L-function show qualitatively
beryllium bonds as a lump-hole interaction. We looked at the L-function value on
the BCP of the beryllium bond and larger negative values are found for BeH 2
complexes than for the BeF 2 ones in all cases: −0.339/−0.323 (NH 3 ), −0.114/
−0.087 (PH 3 ), −0.455/−0.429 (H 2 O), −0.138/−0.099 (SH 2 ).
Fig. 17.4 CD curve for F 2 Be–NH 3 , F 2 Be–PH 3 , F 2 Be–OH 2 and F 2 Be–SH 2 complexes
468
K. Mykolayivna Lemishko et al.
bonds is less straightforward. Electron density values at the BCPs are of course
significantly higher in NH 3 and H 2 O complexes than in the PH 3 or SH 2 ones,
because in the latter case more voluminous second-row atoms are involved, so no
direct conclusions can be extracted from these facts with respect to the strength of
the beryllium bond. It should be noted, however that very similar values are found
if we compare BeH 2 /BeF 2 results: 0.061/0.062 (NH 3 ), 0.037/0.034 (PH 3 ),
0.055/0.057 (H 2 O) and 0.034/0.032 (H 2 S), showing that the strength of the
beryllium bond is not necessarily smaller when BeF 2 is involved. Further information can be obtained when looking at the laplacian of the electron density (∇
2
ρ)
as Eskandari did studying our set of complexes [103]. The L-function, defined as
the negative of ∇
2
ρ, presents positive values in regions of charge concentration
(lump) and negative values on regions of charge depletion (hole). As our CD
analysis shows quantitatively, contour maps of the L-function show qualitatively
beryllium bonds as a lump-hole interaction. We looked at the L-function value on
the BCP of the beryllium bond and larger negative values are found for BeH 2
complexes than for the BeF 2 ones in all cases: −0.339/−0.323 (NH 3 ), −0.114/
−0.087 (PH 3 ), −0.455/−0.429 (H 2 O), −0.138/−0.099 (SH 2 ).
Fig. 17.4 CD curve for F 2 Be–NH 3 , F 2 Be–PH 3 , F 2 Be–OH 2 and F 2 Be–SH 2 complexes
468
K. Mykolayivna Lemishko et al.