

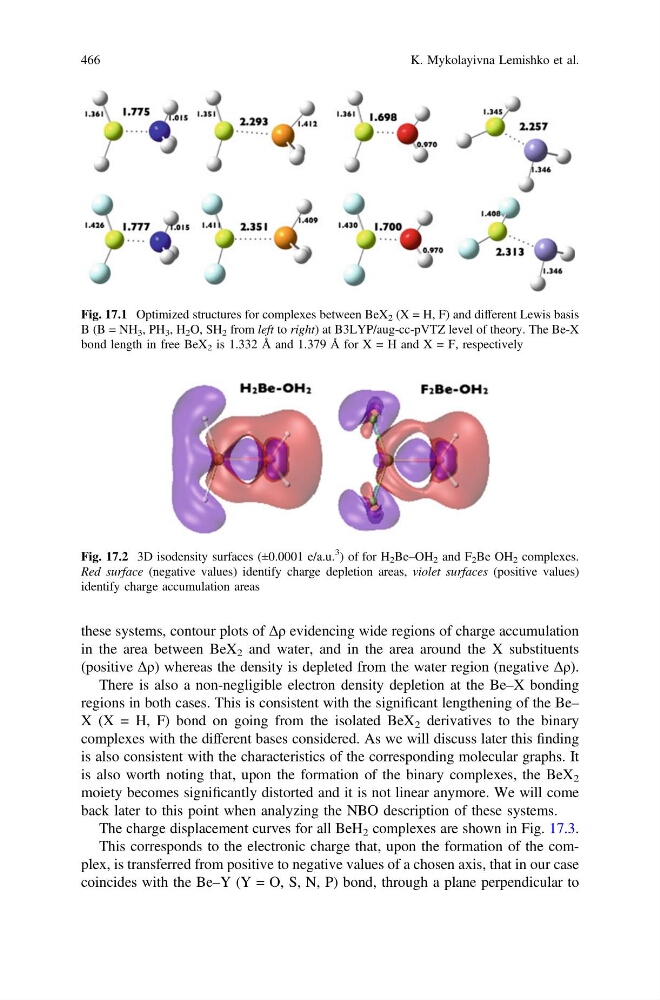
these systems, contour plots of Δρ evidencing wide regions of charge accumulation
in the area between BeX 2 and water, and in the area around the X substituents
(positive Δρ) whereas the density is depleted from the water region (negative Δρ).
There is also a non-negligible electron density depletion at the Be–X bonding
regions in both cases. This is consistent with the significant lengthening of the Be–
X (X = H, F) bond on going from the isolated BeX 2 derivatives to the binary
complexes with the different bases considered. As we will discuss later this finding
is also consistent with the characteristics of the corresponding molecular graphs. It
is also worth noting that, upon the formation of the binary complexes, the BeX 2
moiety becomes significantly distorted and it is not linear anymore. We will come
back later to this point when analyzing the NBO description of these systems.
The charge displacement curves for all BeH 2 complexes are shown in Fig. 17.3.
This corresponds to the electronic charge that, upon the formation of the complex, is transferred from positive to negative values of a chosen axis, that in our case
coincides with the Be–Y (Y = O, S, N, P) bond, through a plane perpendicular to
Fig. 17.1 Optimized structures for complexes between BeX 2 (X = H, F) and different Lewis basis
B (B = NH 3 , PH 3 , H 2 O, SH 2 from left to right) at B3LYP/aug-cc-pVTZ level of theory. The Be-X
bond length in free BeX 2 is 1.332 Å and 1.379 Å for X = H and X = F, respectively
Fig. 17.2 3D isodensity surfaces (±0.0001 e/a.u.
3
) of for H 2 Be–OH 2 and F 2 Be OH 2 complexes.
Red surface (negative values) identify charge depletion areas, violet surfaces (positive values)
identify charge accumulation areas
466
K. Mykolayivna Lemishko et al.
in the area between BeX 2 and water, and in the area around the X substituents
(positive Δρ) whereas the density is depleted from the water region (negative Δρ).
There is also a non-negligible electron density depletion at the Be–X bonding
regions in both cases. This is consistent with the significant lengthening of the Be–
X (X = H, F) bond on going from the isolated BeX 2 derivatives to the binary
complexes with the different bases considered. As we will discuss later this finding
is also consistent with the characteristics of the corresponding molecular graphs. It
is also worth noting that, upon the formation of the binary complexes, the BeX 2
moiety becomes significantly distorted and it is not linear anymore. We will come
back later to this point when analyzing the NBO description of these systems.
The charge displacement curves for all BeH 2 complexes are shown in Fig. 17.3.
This corresponds to the electronic charge that, upon the formation of the complex, is transferred from positive to negative values of a chosen axis, that in our case
coincides with the Be–Y (Y = O, S, N, P) bond, through a plane perpendicular to
Fig. 17.1 Optimized structures for complexes between BeX 2 (X = H, F) and different Lewis basis
B (B = NH 3 , PH 3 , H 2 O, SH 2 from left to right) at B3LYP/aug-cc-pVTZ level of theory. The Be-X
bond length in free BeX 2 is 1.332 Å and 1.379 Å for X = H and X = F, respectively
Fig. 17.2 3D isodensity surfaces (±0.0001 e/a.u.
3
) of for H 2 Be–OH 2 and F 2 Be OH 2 complexes.
Red surface (negative values) identify charge depletion areas, violet surfaces (positive values)
identify charge accumulation areas
466
K. Mykolayivna Lemishko et al.