

analysis was carried out by means of the NBO 3.1 suite of programs [99]. The
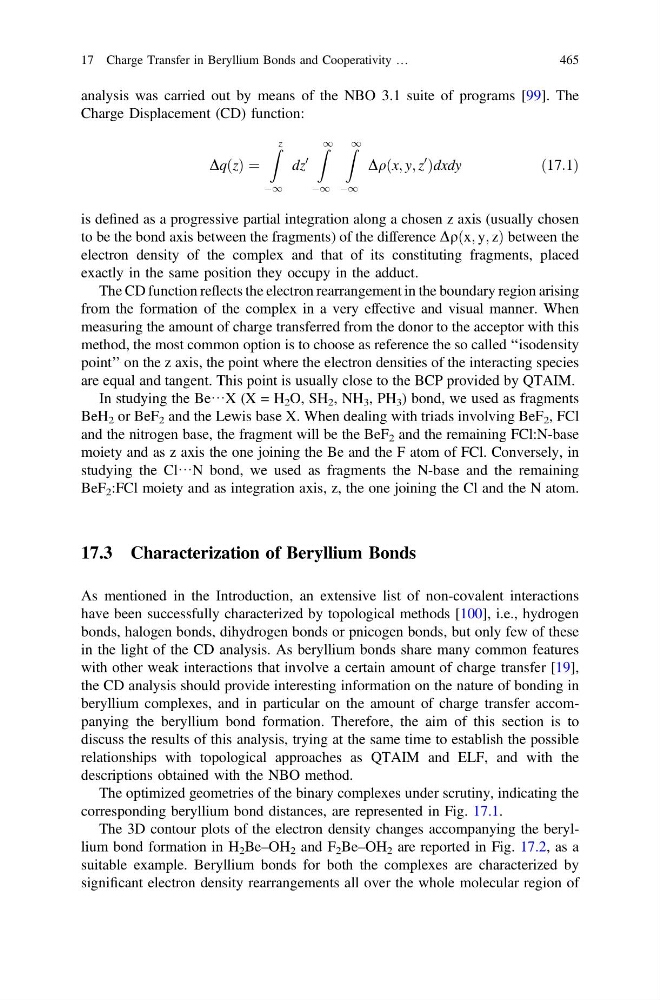
Charge Displacement (CD) function:
DqðzÞ ¼
Z z
À1
dz
0
Z 1
À1
Z 1
À1
Dqðx; y; z
0
Þdxdy
ð17:1Þ
is defined as a progressive partial integration along a chosen z axis (usually chosen
to be the bond axis between the fragments) of the difference Dq x; y; z
ð
Þbetween the
electron density of the complex and that of its constituting fragments, placed
exactly in the same position they occupy in the adduct.
The CD function reflects the electron rearrangement in the boundary region arising
from the formation of the complex in a very effective and visual manner. When
measuring the amount of charge transferred from the donor to the acceptor with this
method, the most common option is to choose as reference the so called ‘‘isodensity
point’’ on the z axis, the point where the electron densities of the interacting species
are equal and tangent. This point is usually close to the BCP provided by QTAIM.
In studying the Be···X (X = H 2 O, SH 2 , NH 3 , PH 3 ) bond, we used as fragments
BeH 2 or BeF 2 and the Lewis base X. When dealing with triads involving BeF 2 , FCl
and the nitrogen base, the fragment will be the BeF 2 and the remaining FCl:N-base
moiety and as z axis the one joining the Be and the F atom of FCl. Conversely, in
studying the Cl···N bond, we used as fragments the N-base and the remaining
BeF 2 :FCl moiety and as integration axis, z, the one joining the Cl and the N atom.
17.3 Characterization of Beryllium Bonds
As mentioned in the Introduction, an extensive list of non-covalent interactions
have been successfully characterized by topological methods [100], i.e., hydrogen
bonds, halogen bonds, dihydrogen bonds or pnicogen bonds, but only few of these
in the light of the CD analysis. As beryllium bonds share many common features
with other weak interactions that involve a certain amount of charge transfer [19],
the CD analysis should provide interesting information on the nature of bonding in
beryllium complexes, and in particular on the amount of charge transfer accompanying the beryllium bond formation. Therefore, the aim of this section is to
discuss the results of this analysis, trying at the same time to establish the possible
relationships with topological approaches as QTAIM and ELF, and with the
descriptions obtained with the NBO method.
The optimized geometries of the binary complexes under scrutiny, indicating the
corresponding beryllium bond distances, are represented in Fig. 17.1.
The 3D contour plots of the electron density changes accompanying the beryllium bond formation in H 2 Be–OH 2 and F 2 Be–OH 2 are reported in Fig. 17.2, as a
suitable example. Beryllium bonds for both the complexes are characterized by
significant electron density rearrangements all over the whole molecular region of
17 Charge Transfer in Beryllium Bonds and Cooperativity …
465
Charge Displacement (CD) function:
DqðzÞ ¼
Z z
À1
dz
0
Z 1
À1
Z 1
À1
Dqðx; y; z
0
Þdxdy
ð17:1Þ
is defined as a progressive partial integration along a chosen z axis (usually chosen
to be the bond axis between the fragments) of the difference Dq x; y; z
ð
Þbetween the
electron density of the complex and that of its constituting fragments, placed
exactly in the same position they occupy in the adduct.
The CD function reflects the electron rearrangement in the boundary region arising
from the formation of the complex in a very effective and visual manner. When
measuring the amount of charge transferred from the donor to the acceptor with this
method, the most common option is to choose as reference the so called ‘‘isodensity
point’’ on the z axis, the point where the electron densities of the interacting species
are equal and tangent. This point is usually close to the BCP provided by QTAIM.
In studying the Be···X (X = H 2 O, SH 2 , NH 3 , PH 3 ) bond, we used as fragments
BeH 2 or BeF 2 and the Lewis base X. When dealing with triads involving BeF 2 , FCl
and the nitrogen base, the fragment will be the BeF 2 and the remaining FCl:N-base
moiety and as z axis the one joining the Be and the F atom of FCl. Conversely, in
studying the Cl···N bond, we used as fragments the N-base and the remaining
BeF 2 :FCl moiety and as integration axis, z, the one joining the Cl and the N atom.
17.3 Characterization of Beryllium Bonds
As mentioned in the Introduction, an extensive list of non-covalent interactions
have been successfully characterized by topological methods [100], i.e., hydrogen
bonds, halogen bonds, dihydrogen bonds or pnicogen bonds, but only few of these
in the light of the CD analysis. As beryllium bonds share many common features
with other weak interactions that involve a certain amount of charge transfer [19],
the CD analysis should provide interesting information on the nature of bonding in
beryllium complexes, and in particular on the amount of charge transfer accompanying the beryllium bond formation. Therefore, the aim of this section is to
discuss the results of this analysis, trying at the same time to establish the possible
relationships with topological approaches as QTAIM and ELF, and with the
descriptions obtained with the NBO method.
The optimized geometries of the binary complexes under scrutiny, indicating the
corresponding beryllium bond distances, are represented in Fig. 17.1.
The 3D contour plots of the electron density changes accompanying the beryllium bond formation in H 2 Be–OH 2 and F 2 Be–OH 2 are reported in Fig. 17.2, as a
suitable example. Beryllium bonds for both the complexes are characterized by
significant electron density rearrangements all over the whole molecular region of
17 Charge Transfer in Beryllium Bonds and Cooperativity …
465