

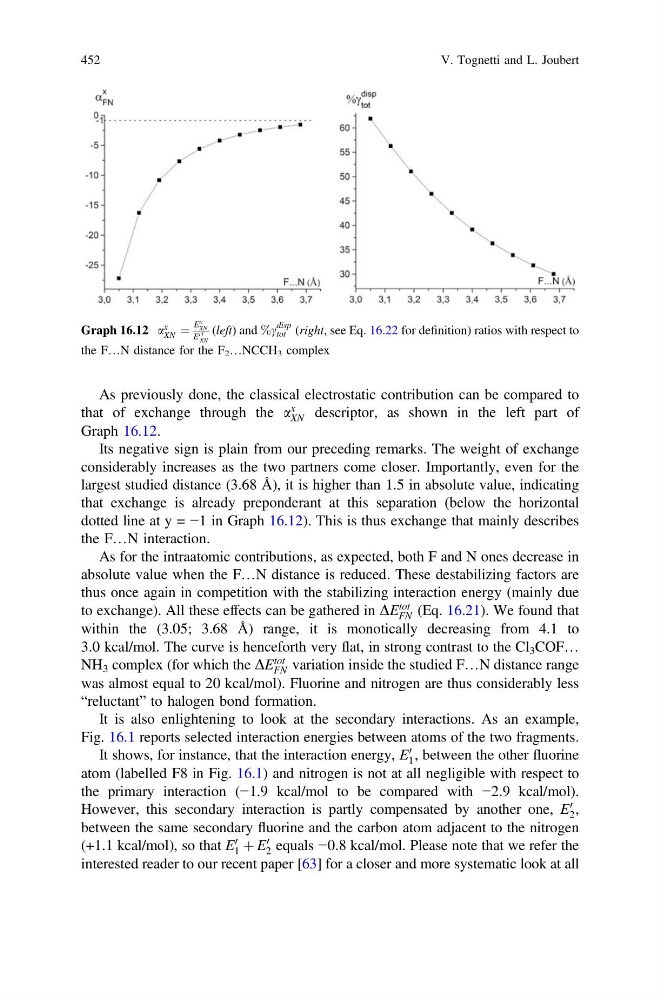
As previously done, the classical electrostatic contribution can be compared to
that of exchange through the a
x
XN descriptor, as shown in the left part of
Graph 16.12.
Its negative sign is plain from our preceding remarks. The weight of exchange
considerably increases as the two partners come closer. Importantly, even for the
largest studied distance (3.68 Å), it is higher than 1.5 in absolute value, indicating
that exchange is already preponderant at this separation (below the horizontal
dotted line at y = −1 in Graph 16.12). This is thus exchange that mainly describes
the F…N interaction.
As for the intraatomic contributions, as expected, both F and N ones decrease in
absolute value when the F…N distance is reduced. These destabilizing factors are
thus once again in competition with the stabilizing interaction energy (mainly due
to exchange). All these effects can be gathered in DE
tot
FN (Eq. 16.21). We found that
within the (3.05; 3.68 Å) range, it is monotically decreasing from 4.1 to
3.0 kcal/mol. The curve is henceforth very flat, in strong contrast to the Cl 3 COF…
NH 3 complex (for which the DE
tot
FN variation inside the studied F…N distance range
was almost equal to 20 kcal/mol). Fluorine and nitrogen are thus considerably less
“reluctant” to halogen bond formation.
It is also enlightening to look at the secondary interactions. As an example,
Fig. 16.1 reports selected interaction energies between atoms of the two fragments.
It shows, for instance, that the interaction energy, E
0
1 , between the other fluorine
atom (labelled F8 in Fig. 16.1) and nitrogen is not at all negligible with respect to
the primary interaction (−1.9 kcal/mol to be compared with −2.9 kcal/mol).
However, this secondary interaction is partly compensated by another one, E
0
2 ,
between the same secondary fluorine and the carbon atom adjacent to the nitrogen
(+1.1 kcal/mol), so that E
0
1 þ E
0
2 equals −0.8 kcal/mol. Please note that we refer the
interested reader to our recent paper [63] for a closer and more systematic look at all
Graph 16.12 a
x
XN ¼
E
x
XN
E cl
XN
(left) and %c
disp
tot (right, see Eq. 16.22 for definition) ratios with respect to
the F…N distance for the F 2 …NCCH 3 complex
452
V. Tognetti and L. Joubert
that of exchange through the a
x
XN descriptor, as shown in the left part of
Graph 16.12.
Its negative sign is plain from our preceding remarks. The weight of exchange
considerably increases as the two partners come closer. Importantly, even for the
largest studied distance (3.68 Å), it is higher than 1.5 in absolute value, indicating
that exchange is already preponderant at this separation (below the horizontal
dotted line at y = −1 in Graph 16.12). This is thus exchange that mainly describes
the F…N interaction.
As for the intraatomic contributions, as expected, both F and N ones decrease in
absolute value when the F…N distance is reduced. These destabilizing factors are
thus once again in competition with the stabilizing interaction energy (mainly due
to exchange). All these effects can be gathered in DE
tot
FN (Eq. 16.21). We found that
within the (3.05; 3.68 Å) range, it is monotically decreasing from 4.1 to
3.0 kcal/mol. The curve is henceforth very flat, in strong contrast to the Cl 3 COF…
NH 3 complex (for which the DE
tot
FN variation inside the studied F…N distance range
was almost equal to 20 kcal/mol). Fluorine and nitrogen are thus considerably less
“reluctant” to halogen bond formation.
It is also enlightening to look at the secondary interactions. As an example,
Fig. 16.1 reports selected interaction energies between atoms of the two fragments.
It shows, for instance, that the interaction energy, E
0
1 , between the other fluorine
atom (labelled F8 in Fig. 16.1) and nitrogen is not at all negligible with respect to
the primary interaction (−1.9 kcal/mol to be compared with −2.9 kcal/mol).
However, this secondary interaction is partly compensated by another one, E
0
2 ,
between the same secondary fluorine and the carbon atom adjacent to the nitrogen
(+1.1 kcal/mol), so that E
0
1 þ E
0
2 equals −0.8 kcal/mol. Please note that we refer the
interested reader to our recent paper [63] for a closer and more systematic look at all
Graph 16.12 a
x
XN ¼
E
x
XN
E cl
XN
(left) and %c
disp
tot (right, see Eq. 16.22 for definition) ratios with respect to
the F…N distance for the F 2 …NCCH 3 complex
452
V. Tognetti and L. Joubert