

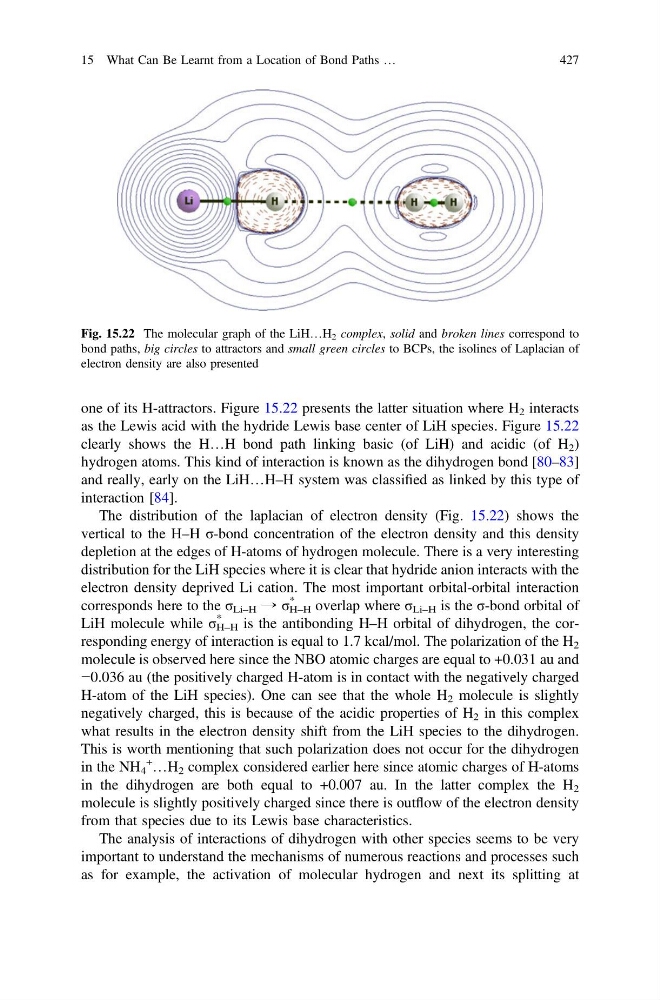
one of its H-attractors. Figure 15.22 presents the latter situation where H 2 interacts
as the Lewis acid with the hydride Lewis base center of LiH species. Figure 15.22
clearly shows the H…H bond path linking basic (of LiH) and acidic (of H 2 )
hydrogen atoms. This kind of interaction is known as the dihydrogen bond [80–83]
and really, early on the LiH…H–H system was classified as linked by this type of
interaction [84].
The distribution of the laplacian of electron density (Fig. 15.22) shows the
vertical to the H–H σ-bond concentration of the electron density and this density
depletion at the edges of H-atoms of hydrogen molecule. There is a very interesting
distribution for the LiH species where it is clear that hydride anion interacts with the
electron density deprived Li cation. The most important orbital-orbital interaction
corresponds here to the σ Li–H → σ H–H
*
overlap where σ Li–H is the σ-bond orbital of
LiH molecule while σ H–H
*
is the antibonding H–H orbital of dihydrogen, the corresponding energy of interaction is equal to 1.7 kcal/mol. The polarization of the H 2
molecule is observed here since the NBO atomic charges are equal to +0.031 au and
−0.036 au (the positively charged H-atom is in contact with the negatively charged
H-atom of the LiH species). One can see that the whole H 2 molecule is slightly
negatively charged, this is because of the acidic properties of H 2 in this complex
what results in the electron density shift from the LiH species to the dihydrogen.
This is worth mentioning that such polarization does not occur for the dihydrogen
in the NH 4
+
…H 2 complex considered earlier here since atomic charges of H-atoms
in the dihydrogen are both equal to +0.007 au. In the latter complex the H 2
molecule is slightly positively charged since there is outflow of the electron density
from that species due to its Lewis base characteristics.
The analysis of interactions of dihydrogen with other species seems to be very
important to understand the mechanisms of numerous reactions and processes such
as for example, the activation of molecular hydrogen and next its splitting at
Fig. 15.22 The molecular graph of the LiH…H 2 complex, solid and broken lines correspond to
bond paths, big circles to attractors and small green circles to BCPs, the isolines of Laplacian of
electron density are also presented
15 What Can Be Learnt from a Location of Bond Paths …
427
as the Lewis acid with the hydride Lewis base center of LiH species. Figure 15.22
clearly shows the H…H bond path linking basic (of LiH) and acidic (of H 2 )
hydrogen atoms. This kind of interaction is known as the dihydrogen bond [80–83]
and really, early on the LiH…H–H system was classified as linked by this type of
interaction [84].
The distribution of the laplacian of electron density (Fig. 15.22) shows the
vertical to the H–H σ-bond concentration of the electron density and this density
depletion at the edges of H-atoms of hydrogen molecule. There is a very interesting
distribution for the LiH species where it is clear that hydride anion interacts with the
electron density deprived Li cation. The most important orbital-orbital interaction
corresponds here to the σ Li–H → σ H–H
*
overlap where σ Li–H is the σ-bond orbital of
LiH molecule while σ H–H
*
is the antibonding H–H orbital of dihydrogen, the corresponding energy of interaction is equal to 1.7 kcal/mol. The polarization of the H 2
molecule is observed here since the NBO atomic charges are equal to +0.031 au and
−0.036 au (the positively charged H-atom is in contact with the negatively charged
H-atom of the LiH species). One can see that the whole H 2 molecule is slightly
negatively charged, this is because of the acidic properties of H 2 in this complex
what results in the electron density shift from the LiH species to the dihydrogen.
This is worth mentioning that such polarization does not occur for the dihydrogen
in the NH 4
+
…H 2 complex considered earlier here since atomic charges of H-atoms
in the dihydrogen are both equal to +0.007 au. In the latter complex the H 2
molecule is slightly positively charged since there is outflow of the electron density
from that species due to its Lewis base characteristics.
The analysis of interactions of dihydrogen with other species seems to be very
important to understand the mechanisms of numerous reactions and processes such
as for example, the activation of molecular hydrogen and next its splitting at
Fig. 15.22 The molecular graph of the LiH…H 2 complex, solid and broken lines correspond to
bond paths, big circles to attractors and small green circles to BCPs, the isolines of Laplacian of
electron density are also presented
15 What Can Be Learnt from a Location of Bond Paths …
427