

positions of the local maxima of the electron density; they may be attributed to the
positions of atoms. However if one assumes that the atoms’ positions correspond to
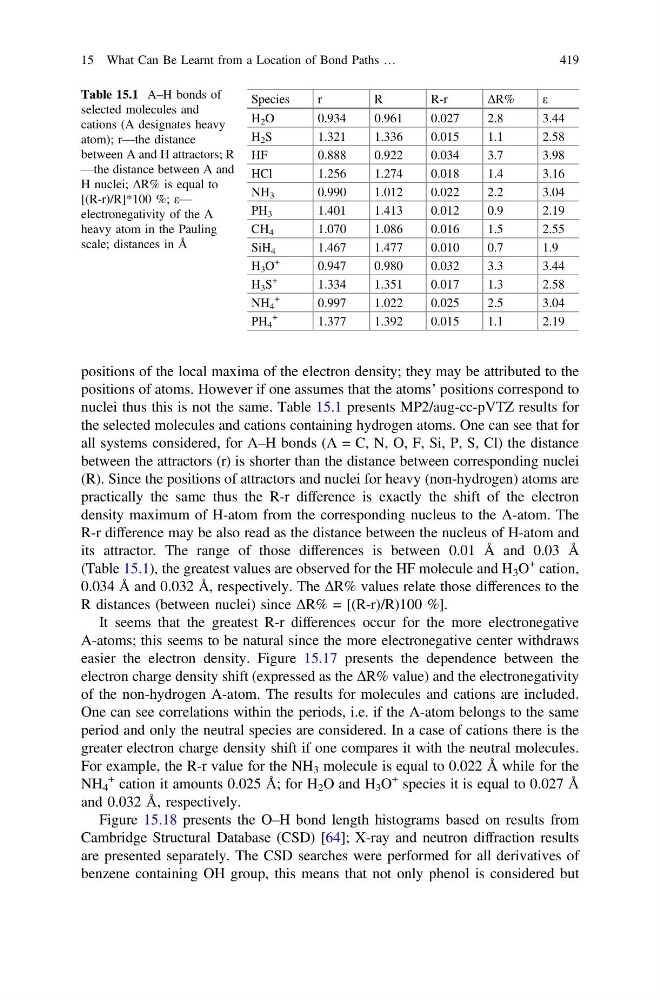
nuclei thus this is not the same. Table 15.1 presents MP2/aug-cc-pVTZ results for
the selected molecules and cations containing hydrogen atoms. One can see that for
all systems considered, for A–H bonds (A = C, N, O, F, Si, P, S, Cl) the distance
between the attractors (r) is shorter than the distance between corresponding nuclei
(R). Since the positions of attractors and nuclei for heavy (non-hydrogen) atoms are
practically the same thus the R-r difference is exactly the shift of the electron
density maximum of H-atom from the corresponding nucleus to the A-atom. The
R-r difference may be also read as the distance between the nucleus of H-atom and
its attractor. The range of those differences is between 0.01 Å and 0.03 Å
(Table 15.1), the greatest values are observed for the HF molecule and H 3 O
+ cation,
0.034 Å and 0.032 Å, respectively. The ΔR% values relate those differences to the
R distances (between nuclei) since ΔR% = [(R-r)/R)100 %].
It seems that the greatest R-r differences occur for the more electronegative
A-atoms; this seems to be natural since the more electronegative center withdraws
easier the electron density. Figure 15.17 presents the dependence between the
electron charge density shift (expressed as the ΔR% value) and the electronegativity
of the non-hydrogen A-atom. The results for molecules and cations are included.
One can see correlations within the periods, i.e. if the A-atom belongs to the same
period and only the neutral species are considered. In a case of cations there is the
greater electron charge density shift if one compares it with the neutral molecules.
For example, the R-r value for the NH 3 molecule is equal to 0.022 Å while for the
NH 4
+ cation it amounts 0.025 Å; for H 2 O and H 3 O
+ species it is equal to 0.027 Å
and 0.032 Å, respectively.
Figure 15.18 presents the O–H bond length histograms based on results from
Cambridge Structural Database (CSD) [64]; X-ray and neutron diffraction results
are presented separately. The CSD searches were performed for all derivatives of
benzene containing OH group, this means that not only phenol is considered but
Table 15.1 A–H bonds of
selected molecules and
cations (A designates heavy
atom); r—the distance
between A and H attractors; R
—the distance between A and
H nuclei; ΔR% is equal to
[(R-r)/R]*100 %; ε—
electronegativity of the A
heavy atom in the Pauling
scale; distances in Å
Species
r
R
R-r
ΔR%
ε
H 2 O
0.934
0.961
0.027
2.8
3.44
H 2 S
1.321
1.336
0.015
1.1
2.58
HF
0.888
0.922
0.034
3.7
3.98
HCl
1.256
1.274
0.018
1.4
3.16
NH 3
0.990
1.012
0.022
2.2
3.04
PH 3
1.401
1.413
0.012
0.9
2.19
CH 4
1.070
1.086
0.016
1.5
2.55
SiH 4
1.467
1.477
0.010
0.7
1.9
H 3 O
+
0.947
0.980
0.032
3.3
3.44
H 3 S
+
1.334
1.351
0.017
1.3
2.58
NH 4
+
0.997
1.022
0.025
2.5
3.04
PH 4
+
1.377
1.392
0.015
1.1
2.19
15 What Can Be Learnt from a Location of Bond Paths …
419
positions of atoms. However if one assumes that the atoms’ positions correspond to
nuclei thus this is not the same. Table 15.1 presents MP2/aug-cc-pVTZ results for
the selected molecules and cations containing hydrogen atoms. One can see that for
all systems considered, for A–H bonds (A = C, N, O, F, Si, P, S, Cl) the distance
between the attractors (r) is shorter than the distance between corresponding nuclei
(R). Since the positions of attractors and nuclei for heavy (non-hydrogen) atoms are
practically the same thus the R-r difference is exactly the shift of the electron
density maximum of H-atom from the corresponding nucleus to the A-atom. The
R-r difference may be also read as the distance between the nucleus of H-atom and
its attractor. The range of those differences is between 0.01 Å and 0.03 Å
(Table 15.1), the greatest values are observed for the HF molecule and H 3 O
+ cation,
0.034 Å and 0.032 Å, respectively. The ΔR% values relate those differences to the
R distances (between nuclei) since ΔR% = [(R-r)/R)100 %].
It seems that the greatest R-r differences occur for the more electronegative
A-atoms; this seems to be natural since the more electronegative center withdraws
easier the electron density. Figure 15.17 presents the dependence between the
electron charge density shift (expressed as the ΔR% value) and the electronegativity
of the non-hydrogen A-atom. The results for molecules and cations are included.
One can see correlations within the periods, i.e. if the A-atom belongs to the same
period and only the neutral species are considered. In a case of cations there is the
greater electron charge density shift if one compares it with the neutral molecules.
For example, the R-r value for the NH 3 molecule is equal to 0.022 Å while for the
NH 4
+ cation it amounts 0.025 Å; for H 2 O and H 3 O
+ species it is equal to 0.027 Å
and 0.032 Å, respectively.
Figure 15.18 presents the O–H bond length histograms based on results from
Cambridge Structural Database (CSD) [64]; X-ray and neutron diffraction results
are presented separately. The CSD searches were performed for all derivatives of
benzene containing OH group, this means that not only phenol is considered but
Table 15.1 A–H bonds of
selected molecules and
cations (A designates heavy
atom); r—the distance
between A and H attractors; R
—the distance between A and
H nuclei; ΔR% is equal to
[(R-r)/R]*100 %; ε—
electronegativity of the A
heavy atom in the Pauling
scale; distances in Å
Species
r
R
R-r
ΔR%
ε
H 2 O
0.934
0.961
0.027
2.8
3.44
H 2 S
1.321
1.336
0.015
1.1
2.58
HF
0.888
0.922
0.034
3.7
3.98
HCl
1.256
1.274
0.018
1.4
3.16
NH 3
0.990
1.012
0.022
2.2
3.04
PH 3
1.401
1.413
0.012
0.9
2.19
CH 4
1.070
1.086
0.016
1.5
2.55
SiH 4
1.467
1.477
0.010
0.7
1.9
H 3 O
+
0.947
0.980
0.032
3.3
3.44
H 3 S
+
1.334
1.351
0.017
1.3
2.58
NH 4
+
0.997
1.022
0.025
2.5
3.04
PH 4
+
1.377
1.392
0.015
1.1
2.19
15 What Can Be Learnt from a Location of Bond Paths …
419