

As can be seen the snapshots in Fig. 10.7a and in Fig. 10.13a–c, clearly describe
the proton transfer from O1 to O5. Also the disappearance of the disynaptic basin
between C3 and O5 can be followed comparing the snapshots (a) and (b) of
Fig. 10.13, since the green V(C3,O5) disynaptic basin in (a) disappears in (b). As
already mentioned, the closure of the lactone ring is the last step, and the small
green bonding basin between C3 and O1 cannot be seen until SSD-VI is reached,
snapshot (e) in Fig. 10.13.
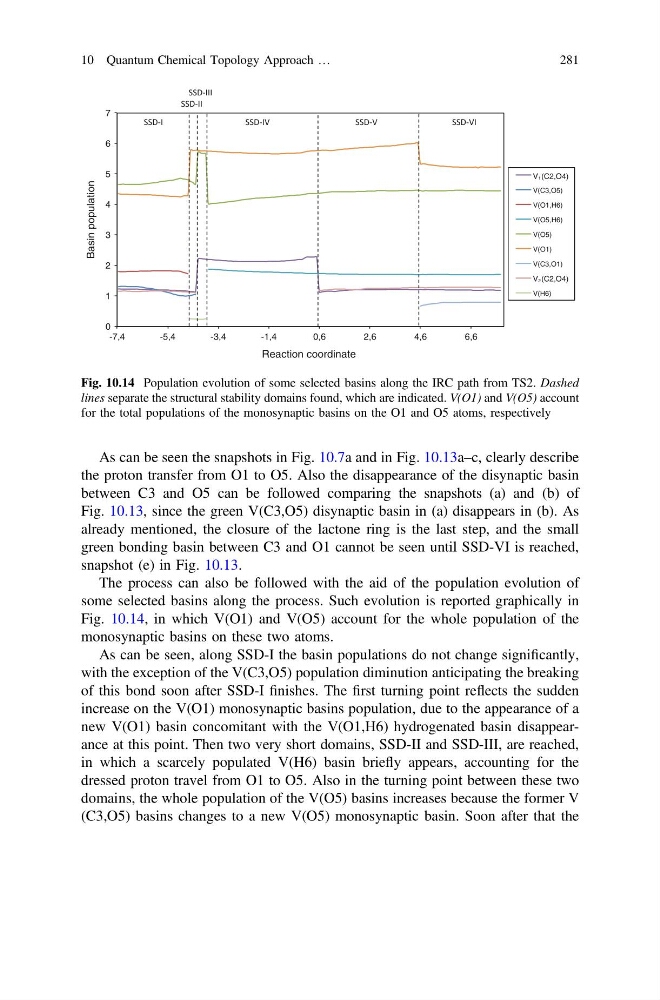
The process can also be followed with the aid of the population evolution of
some selected basins along the process. Such evolution is reported graphically in
Fig. 10.14, in which V(O1) and V(O5) account for the whole population of the
monosynaptic basins on these two atoms.
As can be seen, along SSD-I the basin populations do not change significantly,
with the exception of the V(C3,O5) population diminution anticipating the breaking
of this bond soon after SSD-I finishes. The first turning point reflects the sudden
increase on the V(O1) monosynaptic basins population, due to the appearance of a
new V(O1) basin concomitant with the V(O1,H6) hydrogenated basin disappearance at this point. Then two very short domains, SSD-II and SSD-III, are reached,
in which a scarcely populated V(H6) basin briefly appears, accounting for the
dressed proton travel from O1 to O5. Also in the turning point between these two
domains, the whole population of the V(O5) basins increases because the former V
(C3,O5) basins changes to a new V(O5) monosynaptic basin. Soon after that the
0
1
2
3
4
5
6
7
-7,4
-5,4
-3,4
-1,4
0,6
2,6
4,6
6,6
Basin population
Reaction coordinate
V(C3,O5)
V(O1,H6)
V(O5,H6)
V(O5)
V(O1)
V(C3,O1)
V(H6)
V1(C2,O4)
V2(C2,O4)
Fig. 10.14 Population evolution of some selected basins along the IRC path from TS2. Dashed
lines separate the structural stability domains found, which are indicated. V(O1) and V(O5) account
for the total populations of the monosynaptic basins on the O1 and O5 atoms, respectively
10 Quantum Chemical Topology Approach …
281
the proton transfer from O1 to O5. Also the disappearance of the disynaptic basin
between C3 and O5 can be followed comparing the snapshots (a) and (b) of
Fig. 10.13, since the green V(C3,O5) disynaptic basin in (a) disappears in (b). As
already mentioned, the closure of the lactone ring is the last step, and the small
green bonding basin between C3 and O1 cannot be seen until SSD-VI is reached,
snapshot (e) in Fig. 10.13.
The process can also be followed with the aid of the population evolution of
some selected basins along the process. Such evolution is reported graphically in
Fig. 10.14, in which V(O1) and V(O5) account for the whole population of the
monosynaptic basins on these two atoms.
As can be seen, along SSD-I the basin populations do not change significantly,
with the exception of the V(C3,O5) population diminution anticipating the breaking
of this bond soon after SSD-I finishes. The first turning point reflects the sudden
increase on the V(O1) monosynaptic basins population, due to the appearance of a
new V(O1) basin concomitant with the V(O1,H6) hydrogenated basin disappearance at this point. Then two very short domains, SSD-II and SSD-III, are reached,
in which a scarcely populated V(H6) basin briefly appears, accounting for the
dressed proton travel from O1 to O5. Also in the turning point between these two
domains, the whole population of the V(O5) basins increases because the former V
(C3,O5) basins changes to a new V(O5) monosynaptic basin. Soon after that the
0
1
2
3
4
5
6
7
-7,4
-5,4
-3,4
-1,4
0,6
2,6
4,6
6,6
Basin population
Reaction coordinate
V(C3,O5)
V(O1,H6)
V(O5,H6)
V(O5)
V(O1)
V(C3,O1)
V(H6)
V1(C2,O4)
V2(C2,O4)
Fig. 10.14 Population evolution of some selected basins along the IRC path from TS2. Dashed
lines separate the structural stability domains found, which are indicated. V(O1) and V(O5) account
for the total populations of the monosynaptic basins on the O1 and O5 atoms, respectively
10 Quantum Chemical Topology Approach …
281