

lie where they do. Recalculation of the Eisenstein and Perutz data without these
points gives revised slopes of 1.33 and 1.71, respectively. The latter is about 24%
higher than seen in Fig. 3 (slope ¼ 1.39) and even higher by 7% than the
DFT-calculated data seen in Fig. 4 (1.59). This difference between calculated
slopes obtained by Eisenstein could be due to either use of a different functional
(B3PW91 vs. MO62X) or use of a simplified model or both. The data for the
titanium plot also included data for benzyl and methallyl. Removal of these data
points gives a slope of 1.33 for the DFT-calculated bond strengths (B3PW91) vs. a
slope of 1.35 for experiment, indicating very good agreement. Therefore, DFT can
serve as a useful predictor of M–C bond trends, within the above limits.
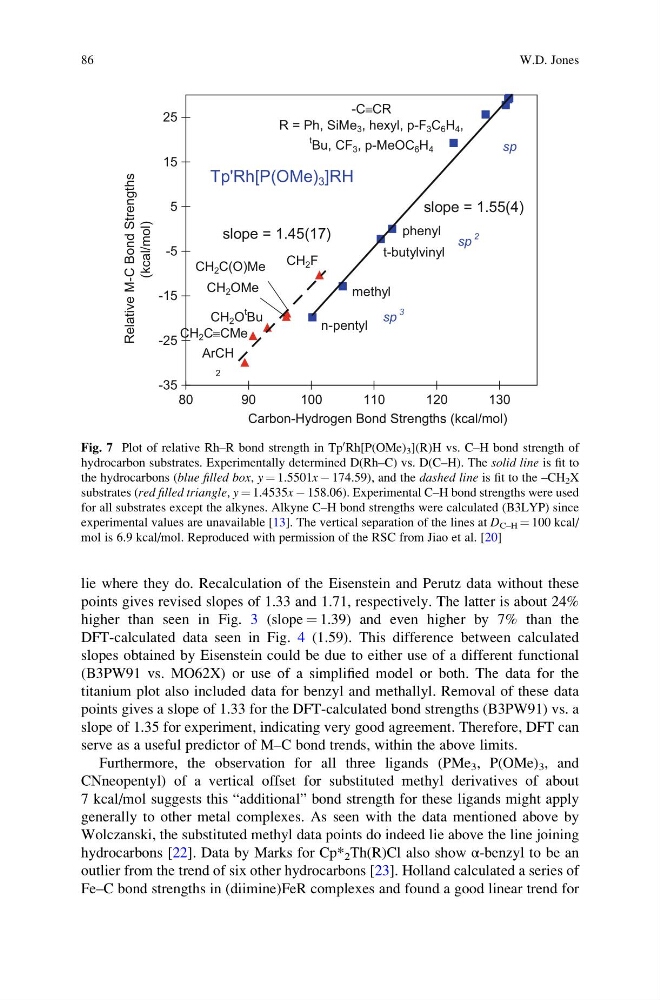
Furthermore, the observation for all three ligands (PMe 3 , P(OMe) 3 , and
CNneopentyl) of a vertical offset for substituted methyl derivatives of about
7 kcal/mol suggests this “additional” bond strength for these ligands might apply
generally to other metal complexes. As seen with the data mentioned above by
Wolczanski, the substituted methyl data points do indeed lie above the line joining
hydrocarbons [22]. Data by Marks for Cp* 2 Th(R)Cl also show α-benzyl to be an
outlier from the trend of six other hydrocarbons [23]. Holland calculated a series of
Fe–C bond strengths in (diimine)FeR complexes and found a good linear trend for
-35
-25
-15
-5
5
15
25
80
90
100
110
120
130
Carbon-Hydrogen Bond Strengths (kcal/mol)
Relative M-C Bond Strengths
(kcal/mol)
methyl
n-pentyl
phenyl
t-butylvinyl
slope = 1.45(17)
slope = 1.55(4)
-CºCR
R = Ph, SiMe 3 , hexyl, p-F 3 C 6 H 4 ,
t Bu, CF 3 , p-MeOC 6 H 4
CH 2 F
CH 2 OMe
CH 2 O
t Bu
ArCH
2
CH 2 C(O)Me
CH 2 CºCMe
sp
sp
3
sp
2
Tp'Rh[P(OMe) 3 ]RH
Fig. 7 Plot of relative Rh–R bond strength in Tp
0 Rh[P(OMe) 3 ](R)H vs. C–H bond strength of
hydrocarbon substrates. Experimentally determined D(Rh–C) vs. D(C–H). The solid line is fit to
the hydrocarbons (blue filled box, y ¼ 1.5501x À 174.59), and the dashed line is fit to the –CH 2 X
substrates (red filled triangle, y ¼ 1.4535x À 158.06). Experimental C–H bond strengths were used
for all substrates except the alkynes. Alkyne C–H bond strengths were calculated (B3LYP) since
experimental values are unavailable [13]. The vertical separation of the lines at D C–H ¼ 100 kcal/
mol is 6.9 kcal/mol. Reproduced with permission of the RSC from Jiao et al. [20]
86
W.D. Jones
points gives revised slopes of 1.33 and 1.71, respectively. The latter is about 24%
higher than seen in Fig. 3 (slope ¼ 1.39) and even higher by 7% than the
DFT-calculated data seen in Fig. 4 (1.59). This difference between calculated
slopes obtained by Eisenstein could be due to either use of a different functional
(B3PW91 vs. MO62X) or use of a simplified model or both. The data for the
titanium plot also included data for benzyl and methallyl. Removal of these data
points gives a slope of 1.33 for the DFT-calculated bond strengths (B3PW91) vs. a
slope of 1.35 for experiment, indicating very good agreement. Therefore, DFT can
serve as a useful predictor of M–C bond trends, within the above limits.
Furthermore, the observation for all three ligands (PMe 3 , P(OMe) 3 , and
CNneopentyl) of a vertical offset for substituted methyl derivatives of about
7 kcal/mol suggests this “additional” bond strength for these ligands might apply
generally to other metal complexes. As seen with the data mentioned above by
Wolczanski, the substituted methyl data points do indeed lie above the line joining
hydrocarbons [22]. Data by Marks for Cp* 2 Th(R)Cl also show α-benzyl to be an
outlier from the trend of six other hydrocarbons [23]. Holland calculated a series of
Fe–C bond strengths in (diimine)FeR complexes and found a good linear trend for
-35
-25
-15
-5
5
15
25
80
90
100
110
120
130
Carbon-Hydrogen Bond Strengths (kcal/mol)
Relative M-C Bond Strengths
(kcal/mol)
methyl
n-pentyl
phenyl
t-butylvinyl
slope = 1.45(17)
slope = 1.55(4)
-CºCR
R = Ph, SiMe 3 , hexyl, p-F 3 C 6 H 4 ,
t Bu, CF 3 , p-MeOC 6 H 4
CH 2 F
CH 2 OMe
CH 2 O
t Bu
ArCH
2
CH 2 C(O)Me
CH 2 CºCMe
sp
sp
3
sp
2
Tp'Rh[P(OMe) 3 ]RH
Fig. 7 Plot of relative Rh–R bond strength in Tp
0 Rh[P(OMe) 3 ](R)H vs. C–H bond strength of
hydrocarbon substrates. Experimentally determined D(Rh–C) vs. D(C–H). The solid line is fit to
the hydrocarbons (blue filled box, y ¼ 1.5501x À 174.59), and the dashed line is fit to the –CH 2 X
substrates (red filled triangle, y ¼ 1.4535x À 158.06). Experimental C–H bond strengths were used
for all substrates except the alkynes. Alkyne C–H bond strengths were calculated (B3LYP) since
experimental values are unavailable [13]. The vertical separation of the lines at D C–H ¼ 100 kcal/
mol is 6.9 kcal/mol. Reproduced with permission of the RSC from Jiao et al. [20]
86
W.D. Jones