

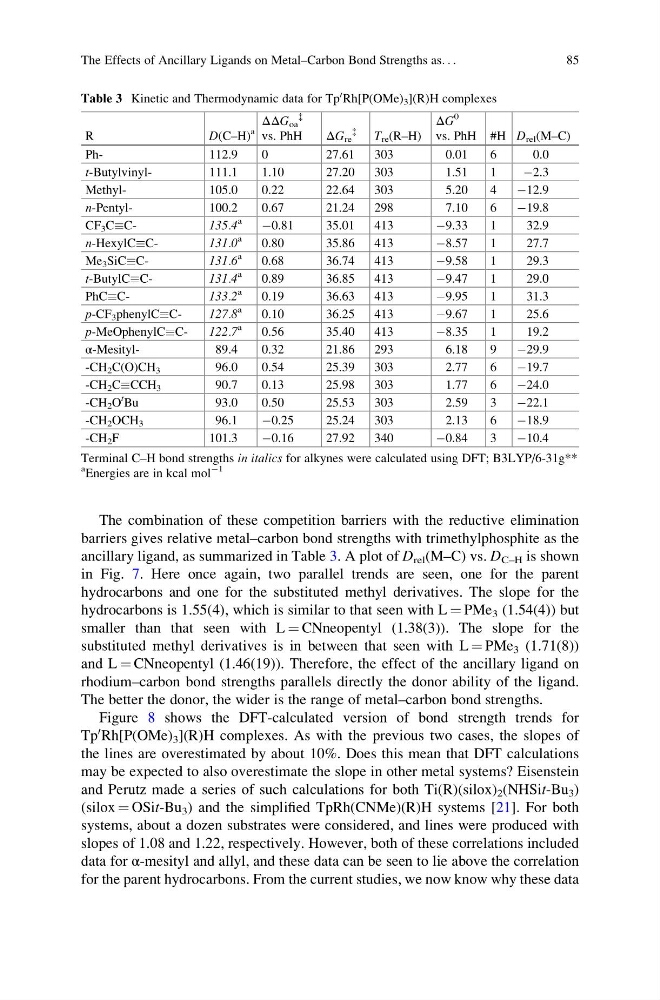
The combination of these competition barriers with the reductive elimination
barriers gives relative metal–carbon bond strengths with trimethylphosphite as the
ancillary ligand, as summarized in Table 3. A plot of D rel (M–C) vs. D C–H is shown
in Fig. 7. Here once again, two parallel trends are seen, one for the parent
hydrocarbons and one for the substituted methyl derivatives. The slope for the
hydrocarbons is 1.55(4), which is similar to that seen with L ¼ PMe 3 (1.54(4)) but
smaller than that seen with L ¼ CNneopentyl (1.38(3)). The slope for the
substituted methyl derivatives is in between that seen with L ¼ PMe 3 (1.71(8))
and L ¼ CNneopentyl (1.46(19)). Therefore, the effect of the ancillary ligand on
rhodium–carbon bond strengths parallels directly the donor ability of the ligand.
The better the donor, the wider is the range of metal–carbon bond strengths.
Figure 8 shows the DFT-calculated version of bond strength trends for
Tp
0 Rh[P(OMe) 3 ](R)H complexes. As with the previous two cases, the slopes of
the lines are overestimated by about 10%. Does this mean that DFT calculations
may be expected to also overestimate the slope in other metal systems? Eisenstein
and Perutz made a series of such calculations for both Ti(R)(silox) 2 (NHSit-Bu 3 )
(silox ¼ OSit-Bu 3 ) and the simplified TpRh(CNMe)(R)H systems [21]. For both
systems, about a dozen substrates were considered, and lines were produced with
slopes of 1.08 and 1.22, respectively. However, both of these correlations included
data for α-mesityl and allyl, and these data can be seen to lie above the correlation
for the parent hydrocarbons. From the current studies, we now know why these data
Table 3 Kinetic and Thermodynamic data for Tp
0 Rh[P(OMe) 3 ](R)H complexes
R
D(C–H)
a
ΔΔG oa
{
vs. PhH
ΔG re
{
T re (R–H)
ΔG
0
vs. PhH #H D rel (M–C)
Ph112.9
0
27.61
303
0.01
6
0.0
t-Butylvinyl111.1
1.10
27.20
303
1.51
1
À2.3
Methyl105.0
0.22
22.64
303
5.20
4
À12.9
n-Pentyl100.2
0.67
21.24
298
7.10
6
À19.8
CF 3 CC135.4
a
À0.81
35.01
413
À9.33
1
32.9
n-HexylCC131.0
a
0.80
35.86
413
À8.57
1
27.7
Me 3 SiCC131.6
a
0.68
36.74
413
À9.58
1
29.3
t-ButylCC131.4
a
0.89
36.85
413
À9.47
1
29.0
PhCC133.2
a
0.19
36.63
413
À9.95
1
31.3
p-CF 3 phenylCC127.8
a
0.10
36.25
413
À9.67
1
25.6
p-MeOphenylCC122.7
a
0.56
35.40
413
À8.35
1
19.2
α-Mesityl89.4
0.32
21.86
293
6.18
9
À29.9
-CH 2 C(O)CH 3
96.0
0.54
25.39
303
2.77
6
À19.7
-CH 2 CCCH 3
90.7
0.13
25.98
303
1.77
6
À24.0
-CH 2 O
t Bu
93.0
0.50
25.53
303
2.59
3
À22.1
-CH 2 OCH 3
96.1
À0.25
25.24
303
2.13
6
À18.9
-CH 2 F
101.3
À0.16
27.92
340
À0.84
3
À10.4
Terminal C–H bond strengths in italics for alkynes were calculated using DFT; B3LYP/6-31g**
a
Energies are in kcal mol
À1
The Effects of Ancillary Ligands on Metal–Carbon Bond Strengths as. . .
85
barriers gives relative metal–carbon bond strengths with trimethylphosphite as the
ancillary ligand, as summarized in Table 3. A plot of D rel (M–C) vs. D C–H is shown
in Fig. 7. Here once again, two parallel trends are seen, one for the parent
hydrocarbons and one for the substituted methyl derivatives. The slope for the
hydrocarbons is 1.55(4), which is similar to that seen with L ¼ PMe 3 (1.54(4)) but
smaller than that seen with L ¼ CNneopentyl (1.38(3)). The slope for the
substituted methyl derivatives is in between that seen with L ¼ PMe 3 (1.71(8))
and L ¼ CNneopentyl (1.46(19)). Therefore, the effect of the ancillary ligand on
rhodium–carbon bond strengths parallels directly the donor ability of the ligand.
The better the donor, the wider is the range of metal–carbon bond strengths.
Figure 8 shows the DFT-calculated version of bond strength trends for
Tp
0 Rh[P(OMe) 3 ](R)H complexes. As with the previous two cases, the slopes of
the lines are overestimated by about 10%. Does this mean that DFT calculations
may be expected to also overestimate the slope in other metal systems? Eisenstein
and Perutz made a series of such calculations for both Ti(R)(silox) 2 (NHSit-Bu 3 )
(silox ¼ OSit-Bu 3 ) and the simplified TpRh(CNMe)(R)H systems [21]. For both
systems, about a dozen substrates were considered, and lines were produced with
slopes of 1.08 and 1.22, respectively. However, both of these correlations included
data for α-mesityl and allyl, and these data can be seen to lie above the correlation
for the parent hydrocarbons. From the current studies, we now know why these data
Table 3 Kinetic and Thermodynamic data for Tp
0 Rh[P(OMe) 3 ](R)H complexes
R
D(C–H)
a
ΔΔG oa
{
vs. PhH
ΔG re
{
T re (R–H)
ΔG
0
vs. PhH #H D rel (M–C)
Ph112.9
0
27.61
303
0.01
6
0.0
t-Butylvinyl111.1
1.10
27.20
303
1.51
1
À2.3
Methyl105.0
0.22
22.64
303
5.20
4
À12.9
n-Pentyl100.2
0.67
21.24
298
7.10
6
À19.8
CF 3 CC135.4
a
À0.81
35.01
413
À9.33
1
32.9
n-HexylCC131.0
a
0.80
35.86
413
À8.57
1
27.7
Me 3 SiCC131.6
a
0.68
36.74
413
À9.58
1
29.3
t-ButylCC131.4
a
0.89
36.85
413
À9.47
1
29.0
PhCC133.2
a
0.19
36.63
413
À9.95
1
31.3
p-CF 3 phenylCC127.8
a
0.10
36.25
413
À9.67
1
25.6
p-MeOphenylCC122.7
a
0.56
35.40
413
À8.35
1
19.2
α-Mesityl89.4
0.32
21.86
293
6.18
9
À29.9
-CH 2 C(O)CH 3
96.0
0.54
25.39
303
2.77
6
À19.7
-CH 2 CCCH 3
90.7
0.13
25.98
303
1.77
6
À24.0
-CH 2 O
t Bu
93.0
0.50
25.53
303
2.59
3
À22.1
-CH 2 OCH 3
96.1
À0.25
25.24
303
2.13
6
À18.9
-CH 2 F
101.3
À0.16
27.92
340
À0.84
3
À10.4
Terminal C–H bond strengths in italics for alkynes were calculated using DFT; B3LYP/6-31g**
a
Energies are in kcal mol
À1
The Effects of Ancillary Ligands on Metal–Carbon Bond Strengths as. . .
85