

alkyls [24]. The calculated Fe–C bond strength for –CH(CH 3 )Ph, however, was
found to lie significantly above the line. Landis also calculated relative metal–
carbon bond strengths for a series of H n M–R complexes where R ¼ Me, Et,
i
Pr,
t Bu,
CH 2 F, vinyl, and CCH. For 27 different metals (Sc–Au), he observed slopes for
M–C vs. C–H plots in the range 1.2–1.9 [25].
Eisenstein and Perutz calculated slopes for fluoroarene activation in [CpRe(CO)
L], [CpRhL], and [CpIrL] (L ¼ CO, PH 3 ) that were 10–20% larger for L ¼ PH 3 than
for L ¼ CO [26]. These calculations are in good agreement with the experimental
effects seen here for exchange of CNR by PMe 3 .
Two other studies worth mentioning here involve the activation of
polyfluorinated benzenes C 6 H n F 6 À n with [Tp
0 RhL] precursors where
L ¼ CNneopentyl or PMe 3 . In these reports, a linear correlation is seen between
D rel (M–Ar
F
) and D Ar F –H [15, 27]. However, the slopes observed are 2.14 and 2.15,
respectively. Here, replacement of CNneopentyl by PMe 3 appears to have no effect
on the range of Rh–C bond strengths. The range of C–H bond strengths spans only
1.5 kcal mol
À1 , so perhaps the range is too small to see a meaningful trend.
-35
-25
-15
-5
5
15
25
80
90
100
110
120
130
Carbon-Hydrogen Bond Strengths (kcal/mol)
Relative M-C Bond Strengths
(kcal/mol)
methyl
n-pentyl
phenyl
t-butylvinyl
slope = 1.51(18)
slope = 1.65(12)
CH 2 F
CH 2 OMe
CH 2 O
t Bu
ArCH 2
CH 2 C(O)Me
CH 2 CºCMe
M062x
CHF 2
CH 2 CF 3
Tp'Rh[P(OMe) 3 ]RH
-CºCR
R = Ph, SiMe 3 , hexyl, p-F 3 C 6 H 4 ,
t Bu, CF 3 , p-MeOC 6 H 4
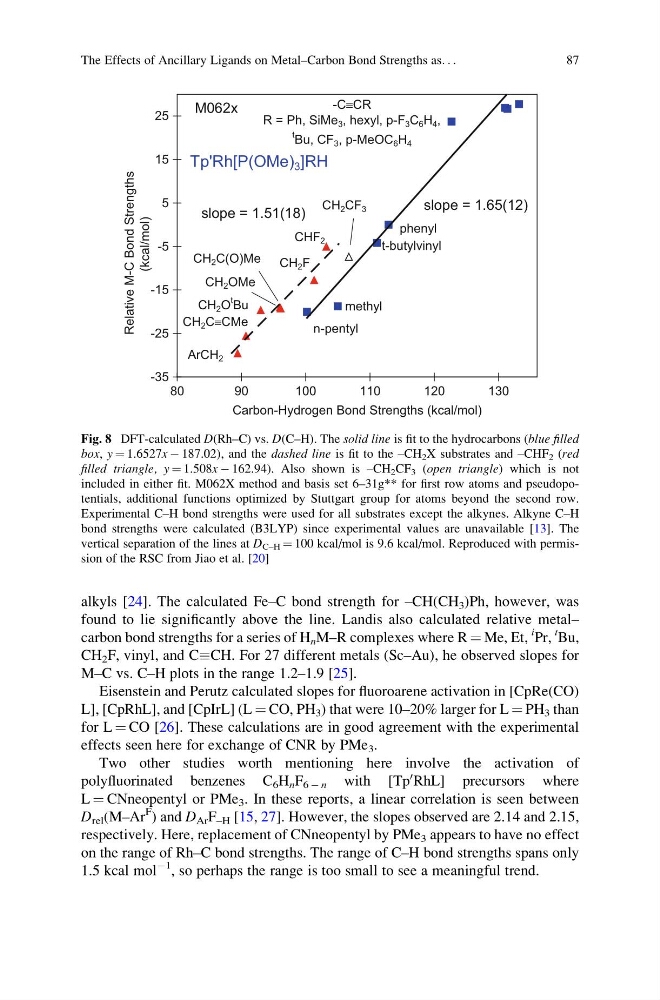
Fig. 8 DFT-calculated D(Rh–C) vs. D(C–H). The solid line is fit to the hydrocarbons (blue filled
box, y ¼ 1.6527x À 187.02), and the dashed line is fit to the –CH 2 X substrates and –CHF 2 (red
filled triangle, y ¼ 1.508x À 162.94). Also shown is –CH 2 CF 3 (open triangle) which is not
included in either fit. M062X method and basis set 6–31g** for first row atoms and pseudopotentials, additional functions optimized by Stuttgart group for atoms beyond the second row.
Experimental C–H bond strengths were used for all substrates except the alkynes. Alkyne C–H
bond strengths were calculated (B3LYP) since experimental values are unavailable [13]. The
vertical separation of the lines at D C–H ¼ 100 kcal/mol is 9.6 kcal/mol. Reproduced with permission of the RSC from Jiao et al. [20]
The Effects of Ancillary Ligands on Metal–Carbon Bond Strengths as. . .
87
found to lie significantly above the line. Landis also calculated relative metal–
carbon bond strengths for a series of H n M–R complexes where R ¼ Me, Et,
i
Pr,
t Bu,
CH 2 F, vinyl, and CCH. For 27 different metals (Sc–Au), he observed slopes for
M–C vs. C–H plots in the range 1.2–1.9 [25].
Eisenstein and Perutz calculated slopes for fluoroarene activation in [CpRe(CO)
L], [CpRhL], and [CpIrL] (L ¼ CO, PH 3 ) that were 10–20% larger for L ¼ PH 3 than
for L ¼ CO [26]. These calculations are in good agreement with the experimental
effects seen here for exchange of CNR by PMe 3 .
Two other studies worth mentioning here involve the activation of
polyfluorinated benzenes C 6 H n F 6 À n with [Tp
0 RhL] precursors where
L ¼ CNneopentyl or PMe 3 . In these reports, a linear correlation is seen between
D rel (M–Ar
F
) and D Ar F –H [15, 27]. However, the slopes observed are 2.14 and 2.15,
respectively. Here, replacement of CNneopentyl by PMe 3 appears to have no effect
on the range of Rh–C bond strengths. The range of C–H bond strengths spans only
1.5 kcal mol
À1 , so perhaps the range is too small to see a meaningful trend.
-35
-25
-15
-5
5
15
25
80
90
100
110
120
130
Carbon-Hydrogen Bond Strengths (kcal/mol)
Relative M-C Bond Strengths
(kcal/mol)
methyl
n-pentyl
phenyl
t-butylvinyl
slope = 1.51(18)
slope = 1.65(12)
CH 2 F
CH 2 OMe
CH 2 O
t Bu
ArCH 2
CH 2 C(O)Me
CH 2 CºCMe
M062x
CHF 2
CH 2 CF 3
Tp'Rh[P(OMe) 3 ]RH
-CºCR
R = Ph, SiMe 3 , hexyl, p-F 3 C 6 H 4 ,
t Bu, CF 3 , p-MeOC 6 H 4
Fig. 8 DFT-calculated D(Rh–C) vs. D(C–H). The solid line is fit to the hydrocarbons (blue filled
box, y ¼ 1.6527x À 187.02), and the dashed line is fit to the –CH 2 X substrates and –CHF 2 (red
filled triangle, y ¼ 1.508x À 162.94). Also shown is –CH 2 CF 3 (open triangle) which is not
included in either fit. M062X method and basis set 6–31g** for first row atoms and pseudopotentials, additional functions optimized by Stuttgart group for atoms beyond the second row.
Experimental C–H bond strengths were used for all substrates except the alkynes. Alkyne C–H
bond strengths were calculated (B3LYP) since experimental values are unavailable [13]. The
vertical separation of the lines at D C–H ¼ 100 kcal/mol is 9.6 kcal/mol. Reproduced with permission of the RSC from Jiao et al. [20]
The Effects of Ancillary Ligands on Metal–Carbon Bond Strengths as. . .
87