

reaction of Tp
0 Rh(PMe 3 )MeCl with Cp 2 ZrH 2 . Loss of methane occurs rapidly at
30
C (τ 1/2 ¼ 35 min), giving rise to an alternate thermal source of [Tp
0 Rh(PMe 3 )].
During the isolation of 5, some methane loss and activation of the THF solvent used
in the synthesis produced variable quantities of Tp
0 Rh(PMe 3 )(tetrahydrofuranyl)H,
which is also a labile source of [Tp
0 Rh(PMe 3 )]. Using 5, many hydrocarbon and
substituted methyl products could be prepared (Scheme 3) [18].
Reaction of mesitylene with 5 gave only the product of benzylic C–H activation,
unlike the reaction with 1 which gave a 3:1 mixture of benzylic/aromatic C–H
activation. The isonitrile ligand appears to induce less crowding at the metal center.
As with 1, CF 3 H proved unreactive. Once again, steric inaccessibility of the C–H
bond is believed to be responsible.
Irradiation of dihydride 4 in neat terminal alkyne led to C–H activation products,
but the lengthy photolysis times led to decomposition products with many of the
acetylenes. Methyl hydride 5 proved to be a good precursor for the activation of
-40
-30
-20
-10
0
10
20
30
40
80
90
100
110
120
130
Carbon-Hydrogen Bond Strengths (kcal/mol)
Calculated M-C Bond Strengths
(kcal/mol)
c -pentyl
methyl
n -pentyl
phenyl
t -butylvinyl
c -hexyl
slope = 1.59(9)
DFT: M062x
slope = 1.46(19)
C 6 F 5
CHF 2
CH 2 F
CH 2 Cl
O
CH 2 CN
MeOCH 2
t BuOCH 2
MeCºCCH 2
ArCH 2
methallyl
-CºCR; R = Ph, SiMe 3 , hexyl,
p -CF 3 C 6 H 4 , t -Bu, CF 3 , p -MeOC 6 H 4
CH 2 CF 3
sp
sp
2
sp
3
Tp'Rh(CNMe)RH
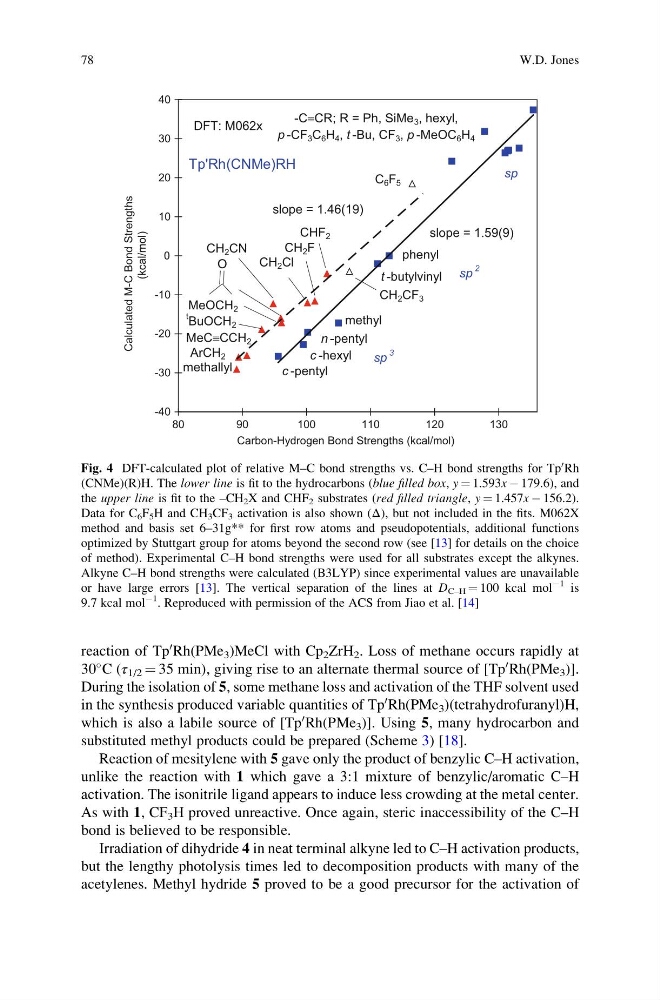
Fig. 4 DFT-calculated plot of relative M–C bond strengths vs. C–H bond strengths for Tp
0 Rh
(CNMe)(R)H. The lower line is fit to the hydrocarbons (blue filled box, y ¼ 1.593x À 179.6), and
the upper line is fit to the –CH 2 X and CHF 2 substrates (red filled triangle, y ¼ 1.457x À 156.2).
Data for C 6 F 5 H and CH 3 CF 3 activation is also shown (Δ), but not included in the fits. M062X
method and basis set 6–31g** for first row atoms and pseudopotentials, additional functions
optimized by Stuttgart group for atoms beyond the second row (see [13] for details on the choice
of method). Experimental C–H bond strengths were used for all substrates except the alkynes.
Alkyne C–H bond strengths were calculated (B3LYP) since experimental values are unavailable
or have large errors [13]. The vertical separation of the lines at D C–H ¼ 100 kcal mol
À1 is
9.7 kcal mol
À1
. Reproduced with permission of the ACS from Jiao et al. [14]
78
W.D. Jones
0 Rh(PMe 3 )MeCl with Cp 2 ZrH 2 . Loss of methane occurs rapidly at
30
C (τ 1/2 ¼ 35 min), giving rise to an alternate thermal source of [Tp
0 Rh(PMe 3 )].
During the isolation of 5, some methane loss and activation of the THF solvent used
in the synthesis produced variable quantities of Tp
0 Rh(PMe 3 )(tetrahydrofuranyl)H,
which is also a labile source of [Tp
0 Rh(PMe 3 )]. Using 5, many hydrocarbon and
substituted methyl products could be prepared (Scheme 3) [18].
Reaction of mesitylene with 5 gave only the product of benzylic C–H activation,
unlike the reaction with 1 which gave a 3:1 mixture of benzylic/aromatic C–H
activation. The isonitrile ligand appears to induce less crowding at the metal center.
As with 1, CF 3 H proved unreactive. Once again, steric inaccessibility of the C–H
bond is believed to be responsible.
Irradiation of dihydride 4 in neat terminal alkyne led to C–H activation products,
but the lengthy photolysis times led to decomposition products with many of the
acetylenes. Methyl hydride 5 proved to be a good precursor for the activation of
-40
-30
-20
-10
0
10
20
30
40
80
90
100
110
120
130
Carbon-Hydrogen Bond Strengths (kcal/mol)
Calculated M-C Bond Strengths
(kcal/mol)
c -pentyl
methyl
n -pentyl
phenyl
t -butylvinyl
c -hexyl
slope = 1.59(9)
DFT: M062x
slope = 1.46(19)
C 6 F 5
CHF 2
CH 2 F
CH 2 Cl
O
CH 2 CN
MeOCH 2
t BuOCH 2
MeCºCCH 2
ArCH 2
methallyl
-CºCR; R = Ph, SiMe 3 , hexyl,
p -CF 3 C 6 H 4 , t -Bu, CF 3 , p -MeOC 6 H 4
CH 2 CF 3
sp
sp
2
sp
3
Tp'Rh(CNMe)RH
Fig. 4 DFT-calculated plot of relative M–C bond strengths vs. C–H bond strengths for Tp
0 Rh
(CNMe)(R)H. The lower line is fit to the hydrocarbons (blue filled box, y ¼ 1.593x À 179.6), and
the upper line is fit to the –CH 2 X and CHF 2 substrates (red filled triangle, y ¼ 1.457x À 156.2).
Data for C 6 F 5 H and CH 3 CF 3 activation is also shown (Δ), but not included in the fits. M062X
method and basis set 6–31g** for first row atoms and pseudopotentials, additional functions
optimized by Stuttgart group for atoms beyond the second row (see [13] for details on the choice
of method). Experimental C–H bond strengths were used for all substrates except the alkynes.
Alkyne C–H bond strengths were calculated (B3LYP) since experimental values are unavailable
or have large errors [13]. The vertical separation of the lines at D C–H ¼ 100 kcal mol
À1 is
9.7 kcal mol
À1
. Reproduced with permission of the ACS from Jiao et al. [14]
78
W.D. Jones