

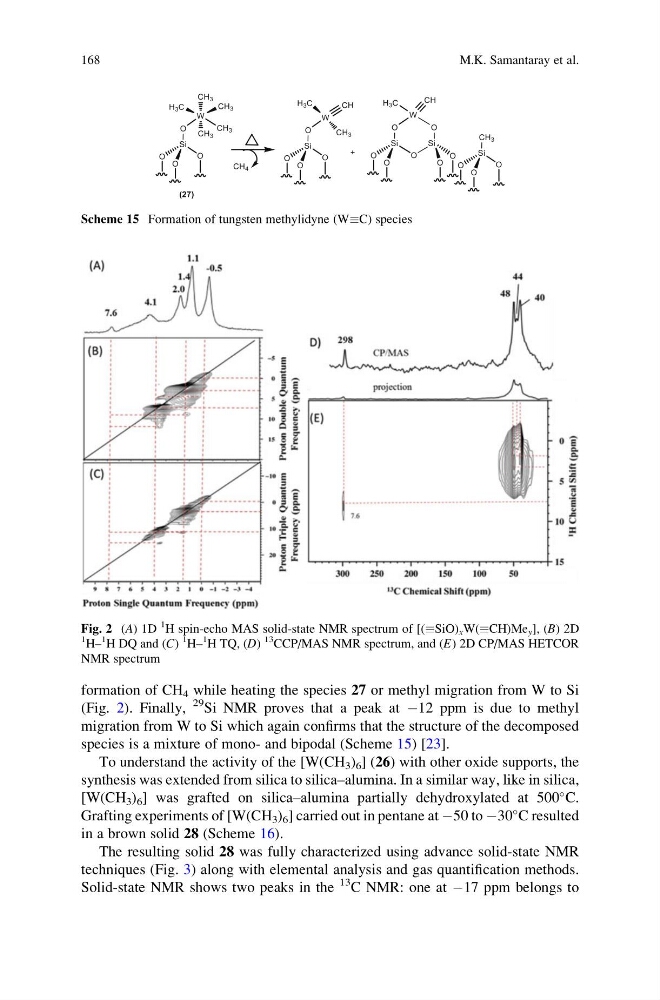
formation of CH 4 while heating the species 27 or methyl migration from W to Si
(Fig. 2). Finally,
29 Si NMR proves that a peak at À12 ppm is due to methyl
migration from W to Si which again confirms that the structure of the decomposed
species is a mixture of mono- and bipodal (Scheme 15) [23].
To understand the activity of the [W(CH 3 ) 6 ] (26) with other oxide supports, the
synthesis was extended from silica to silica–alumina. In a similar way, like in silica,
[W(CH 3 ) 6 ] was grafted on silica–alumina partially dehydroxylated at 500
C.
Grafting experiments of [W(CH 3 ) 6 ] carried out in pentane at À50 to À30
C resulted
in a brown solid 28 (Scheme 16).
The resulting solid 28 was fully characterized using advance solid-state NMR
techniques (Fig. 3) along with elemental analysis and gas quantification methods.
Solid-state NMR shows two peaks in the
13 C NMR: one at À17 ppm belongs to
Scheme 15 Formation of tungsten methylidyne (WC) species
Fig. 2 (A) 1D
1
H spin-echo MAS solid-state NMR spectrum of [(SiO) x W(CH)Me y ], (B) 2D
1
H–
1
H DQ and (C)
1
H–
1
H TQ, (D)
13
CCP/MAS NMR spectrum, and (E) 2D CP/MAS HETCOR
NMR spectrum
168
M.K. Samantaray et al.
(Fig. 2). Finally,
29 Si NMR proves that a peak at À12 ppm is due to methyl
migration from W to Si which again confirms that the structure of the decomposed
species is a mixture of mono- and bipodal (Scheme 15) [23].
To understand the activity of the [W(CH 3 ) 6 ] (26) with other oxide supports, the
synthesis was extended from silica to silica–alumina. In a similar way, like in silica,
[W(CH 3 ) 6 ] was grafted on silica–alumina partially dehydroxylated at 500
C.
Grafting experiments of [W(CH 3 ) 6 ] carried out in pentane at À50 to À30
C resulted
in a brown solid 28 (Scheme 16).
The resulting solid 28 was fully characterized using advance solid-state NMR
techniques (Fig. 3) along with elemental analysis and gas quantification methods.
Solid-state NMR shows two peaks in the
13 C NMR: one at À17 ppm belongs to
Scheme 15 Formation of tungsten methylidyne (WC) species
Fig. 2 (A) 1D
1
H spin-echo MAS solid-state NMR spectrum of [(SiO) x W(CH)Me y ], (B) 2D
1
H–
1
H DQ and (C)
1
H–
1
H TQ, (D)
13
CCP/MAS NMR spectrum, and (E) 2D CP/MAS HETCOR
NMR spectrum
168
M.K. Samantaray et al.