

447
13 Continuous Molecular Fields Approach Applied to Structure-Activity Modeling
negative, FN) but also the number of inactive compounds predicted to be inactive
(true negative, TN) and the number of inactive compounds predicted to be active
(false positive, FP). To determine the last two characteristics, we used structures
resembling the structures of active ligands in their physicochemical properties but
presumed to be inactive (so-called decoys).
We have built one-class models for data taken from the DUD database [47],
which contains the structures of active ligands for different biological targets, as
well as the structures of corresponding decoys. It is worth noting that the latter
were used only for assessing the statistical characteristics of classification models
and were not involved in their construction. In particular, decoys were used for
determining the TN and FP models constructed with the use of active compounds.
The suggested one-class classifier calculates a continuous quantity (a classifier
function), for which the threshold value is determined. If the classifier function calculated for a certain ligand exceeds the threshold value, the compound is considered
active; otherwise, the structure is discarded from further consideration.
Dependence of the FN, FP, TN, and TP on the threshold value is clearly reflected
by a Receiver Operator Characteristic (ROC) curve [48] in the TPR–FPR coordinates (true positive rate versus false positive rate), where TRP = TP/(TP + TN) and
FPR = FP/(FP + TN). The larger the area under the curve (AUC), the higher is the
classifier efficiency.
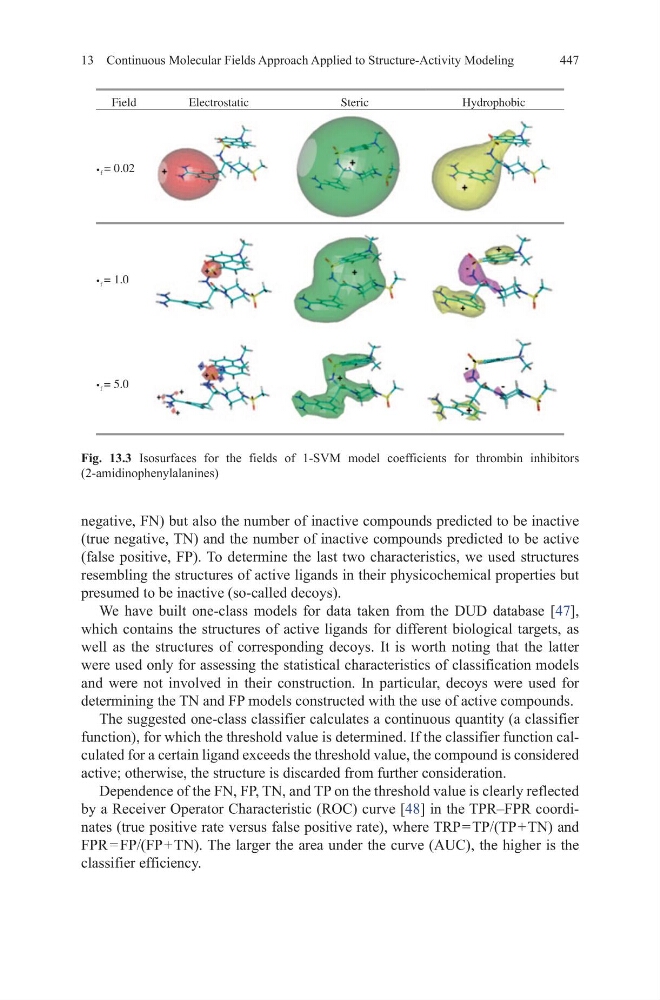
Fig. 13.3 Isosurfaces for the fields of 1-SVM model coefficients for thrombin inhibitors
(2-amidinophenylalanines)
Field
Electrostatic
Steric
Hydrophobic
f = 0.02
f = 1.0
f = 5.0
•
•
•
13 Continuous Molecular Fields Approach Applied to Structure-Activity Modeling
negative, FN) but also the number of inactive compounds predicted to be inactive
(true negative, TN) and the number of inactive compounds predicted to be active
(false positive, FP). To determine the last two characteristics, we used structures
resembling the structures of active ligands in their physicochemical properties but
presumed to be inactive (so-called decoys).
We have built one-class models for data taken from the DUD database [47],
which contains the structures of active ligands for different biological targets, as
well as the structures of corresponding decoys. It is worth noting that the latter
were used only for assessing the statistical characteristics of classification models
and were not involved in their construction. In particular, decoys were used for
determining the TN and FP models constructed with the use of active compounds.
The suggested one-class classifier calculates a continuous quantity (a classifier
function), for which the threshold value is determined. If the classifier function calculated for a certain ligand exceeds the threshold value, the compound is considered
active; otherwise, the structure is discarded from further consideration.
Dependence of the FN, FP, TN, and TP on the threshold value is clearly reflected
by a Receiver Operator Characteristic (ROC) curve [48] in the TPR–FPR coordinates (true positive rate versus false positive rate), where TRP = TP/(TP + TN) and
FPR = FP/(FP + TN). The larger the area under the curve (AUC), the higher is the
classifier efficiency.
Fig. 13.3 Isosurfaces for the fields of 1-SVM model coefficients for thrombin inhibitors
(2-amidinophenylalanines)
Field
Electrostatic
Steric
Hydrophobic
f = 0.02
f = 1.0
f = 5.0
•
•
•