

70
5 Combinatorial Studies of the Spinel and Rocksalt Regions . . .
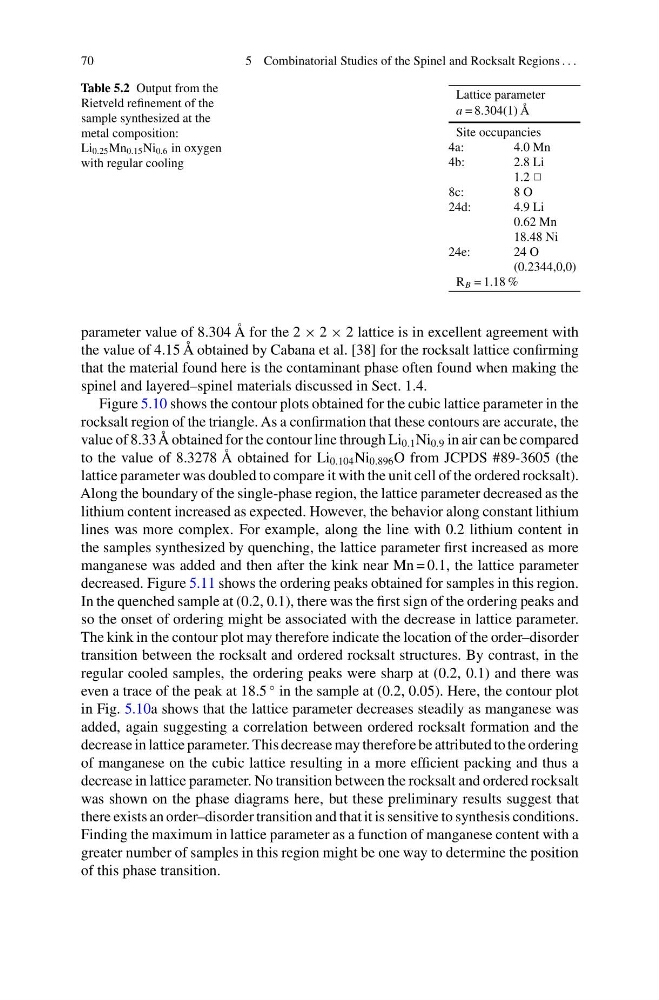
Table 5.2 Output from the
Rietveld refinement of the
sample synthesized at the
metal composition:
Li 0.25 Mn 0.15 Ni 0.6 in oxygen
with regular cooling
Lattice parameter
a = 8.304(1) Å
Site occupancies
4a:
4.0 Mn
4b:
2.8 Li
1.2 P
8c:
8 O
24d:
4.9 Li
0.62 Mn
18.48 Ni
24e:
24 O
(0.2344,0,0)
R B = 1.18 %
parameter value of 8.304 Å for the 2 × 2 × 2 lattice is in excellent agreement with
the value of 4.15 Å obtained by Cabana et al. [38] for the rocksalt lattice confirming
that the material found here is the contaminant phase often found when making the
spinel and layered–spinel materials discussed in Sect. 1.4.
Figure 5.10 shows the contour plots obtained for the cubic lattice parameter in the
rocksalt region of the triangle. As a confirmation that these contours are accurate, the
value of 8.33 Å obtained for the contour line through Li 0.1 Ni 0.9 in air can be compared
to the value of 8.3278 Å obtained for Li 0.104 Ni 0.896 O from JCPDS #89-3605 (the
lattice parameter was doubled to compare it with the unit cell of the ordered rocksalt).
Along the boundary of the single-phase region, the lattice parameter decreased as the
lithium content increased as expected. However, the behavior along constant lithium
lines was more complex. For example, along the line with 0.2 lithium content in
the samples synthesized by quenching, the lattice parameter first increased as more
manganese was added and then after the kink near Mn = 0.1, the lattice parameter
decreased. Figure 5.11 shows the ordering peaks obtained for samples in this region.
In the quenched sample at (0.2, 0.1), there was the first sign of the ordering peaks and
so the onset of ordering might be associated with the decrease in lattice parameter.
The kink in the contour plot may therefore indicate the location of the order–disorder
transition between the rocksalt and ordered rocksalt structures. By contrast, in the
regular cooled samples, the ordering peaks were sharp at (0.2, 0.1) and there was
even a trace of the peak at 18.5
◦ in the sample at (0.2, 0.05). Here, the contour plot
in Fig. 5.10a shows that the lattice parameter decreases steadily as manganese was
added, again suggesting a correlation between ordered rocksalt formation and the
decrease in lattice parameter. This decrease may therefore be attributed to the ordering
of manganese on the cubic lattice resulting in a more efficient packing and thus a
decrease in lattice parameter. No transition between the rocksalt and ordered rocksalt
was shown on the phase diagrams here, but these preliminary results suggest that
there exists an order–disorder transition and that it is sensitive to synthesis conditions.
Finding the maximum in lattice parameter as a function of manganese content with a
greater number of samples in this region might be one way to determine the position
of this phase transition.
5 Combinatorial Studies of the Spinel and Rocksalt Regions . . .
Table 5.2 Output from the
Rietveld refinement of the
sample synthesized at the
metal composition:
Li 0.25 Mn 0.15 Ni 0.6 in oxygen
with regular cooling
Lattice parameter
a = 8.304(1) Å
Site occupancies
4a:
4.0 Mn
4b:
2.8 Li
1.2 P
8c:
8 O
24d:
4.9 Li
0.62 Mn
18.48 Ni
24e:
24 O
(0.2344,0,0)
R B = 1.18 %
parameter value of 8.304 Å for the 2 × 2 × 2 lattice is in excellent agreement with
the value of 4.15 Å obtained by Cabana et al. [38] for the rocksalt lattice confirming
that the material found here is the contaminant phase often found when making the
spinel and layered–spinel materials discussed in Sect. 1.4.
Figure 5.10 shows the contour plots obtained for the cubic lattice parameter in the
rocksalt region of the triangle. As a confirmation that these contours are accurate, the
value of 8.33 Å obtained for the contour line through Li 0.1 Ni 0.9 in air can be compared
to the value of 8.3278 Å obtained for Li 0.104 Ni 0.896 O from JCPDS #89-3605 (the
lattice parameter was doubled to compare it with the unit cell of the ordered rocksalt).
Along the boundary of the single-phase region, the lattice parameter decreased as the
lithium content increased as expected. However, the behavior along constant lithium
lines was more complex. For example, along the line with 0.2 lithium content in
the samples synthesized by quenching, the lattice parameter first increased as more
manganese was added and then after the kink near Mn = 0.1, the lattice parameter
decreased. Figure 5.11 shows the ordering peaks obtained for samples in this region.
In the quenched sample at (0.2, 0.1), there was the first sign of the ordering peaks and
so the onset of ordering might be associated with the decrease in lattice parameter.
The kink in the contour plot may therefore indicate the location of the order–disorder
transition between the rocksalt and ordered rocksalt structures. By contrast, in the
regular cooled samples, the ordering peaks were sharp at (0.2, 0.1) and there was
even a trace of the peak at 18.5
◦ in the sample at (0.2, 0.05). Here, the contour plot
in Fig. 5.10a shows that the lattice parameter decreases steadily as manganese was
added, again suggesting a correlation between ordered rocksalt formation and the
decrease in lattice parameter. This decrease may therefore be attributed to the ordering
of manganese on the cubic lattice resulting in a more efficient packing and thus a
decrease in lattice parameter. No transition between the rocksalt and ordered rocksalt
was shown on the phase diagrams here, but these preliminary results suggest that
there exists an order–disorder transition and that it is sensitive to synthesis conditions.
Finding the maximum in lattice parameter as a function of manganese content with a
greater number of samples in this region might be one way to determine the position
of this phase transition.