

5.4 Mn 2 O 3 –Spinel Coexistence Region
71
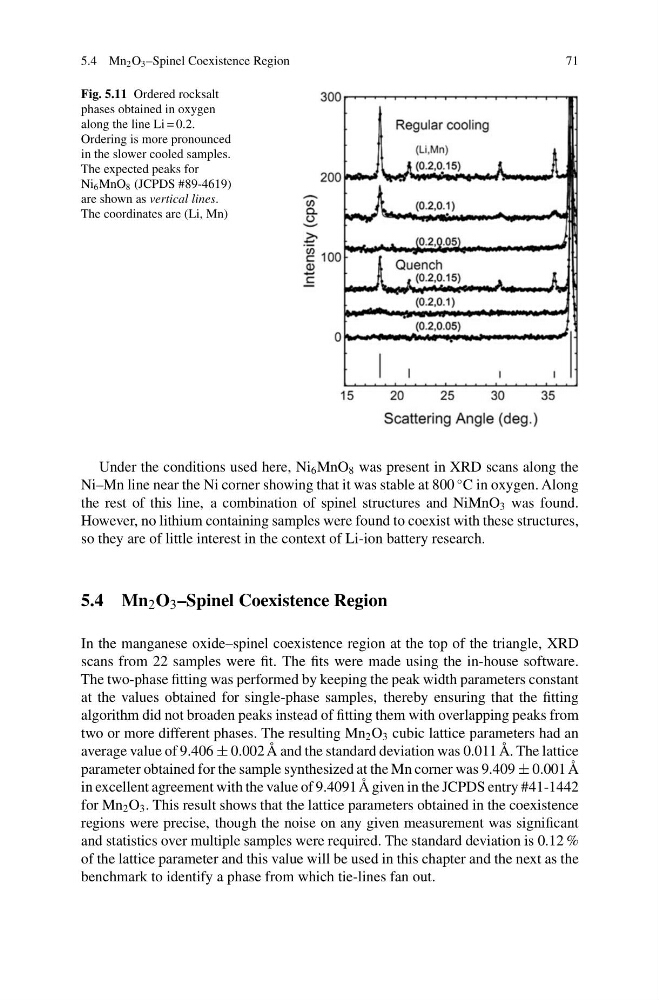
Fig. 5.11 Ordered rocksalt
phases obtained in oxygen
along the line Li = 0.2.
Ordering is more pronounced
in the slower cooled samples.
The expected peaks for
Ni 6 MnO 8 (JCPDS #89-4619)
are shown as vertical lines.
The coordinates are (Li, Mn)
Under the conditions used here, Ni 6 MnO 8 was present in XRD scans along the
Ni–Mn line near the Ni corner showing that it was stable at 800
◦ C in oxygen. Along
the rest of this line, a combination of spinel structures and NiMnO 3 was found.
However, no lithium containing samples were found to coexist with these structures,
so they are of little interest in the context of Li-ion battery research.
5.4 Mn 2 O 3 –Spinel Coexistence Region
In the manganese oxide–spinel coexistence region at the top of the triangle, XRD
scans from 22 samples were fit. The fits were made using the in-house software.
The two-phase fitting was performed by keeping the peak width parameters constant
at the values obtained for single-phase samples, thereby ensuring that the fitting
algorithm did not broaden peaks instead of fitting them with overlapping peaks from
two or more different phases. The resulting Mn 2 O 3 cubic lattice parameters had an
average value of 9.406 ± 0.002 Å and the standard deviation was 0.011 Å. The lattice
parameter obtained for the sample synthesized at the Mn corner was 9.409 ± 0.001 Å
in excellent agreement with the value of 9.4091 Å given in the JCPDS entry #41-1442
for Mn 2 O 3 . This result shows that the lattice parameters obtained in the coexistence
regions were precise, though the noise on any given measurement was significant
and statistics over multiple samples were required. The standard deviation is 0.12 %
of the lattice parameter and this value will be used in this chapter and the next as the
benchmark to identify a phase from which tie-lines fan out.
71
Fig. 5.11 Ordered rocksalt
phases obtained in oxygen
along the line Li = 0.2.
Ordering is more pronounced
in the slower cooled samples.
The expected peaks for
Ni 6 MnO 8 (JCPDS #89-4619)
are shown as vertical lines.
The coordinates are (Li, Mn)
Under the conditions used here, Ni 6 MnO 8 was present in XRD scans along the
Ni–Mn line near the Ni corner showing that it was stable at 800
◦ C in oxygen. Along
the rest of this line, a combination of spinel structures and NiMnO 3 was found.
However, no lithium containing samples were found to coexist with these structures,
so they are of little interest in the context of Li-ion battery research.
5.4 Mn 2 O 3 –Spinel Coexistence Region
In the manganese oxide–spinel coexistence region at the top of the triangle, XRD
scans from 22 samples were fit. The fits were made using the in-house software.
The two-phase fitting was performed by keeping the peak width parameters constant
at the values obtained for single-phase samples, thereby ensuring that the fitting
algorithm did not broaden peaks instead of fitting them with overlapping peaks from
two or more different phases. The resulting Mn 2 O 3 cubic lattice parameters had an
average value of 9.406 ± 0.002 Å and the standard deviation was 0.011 Å. The lattice
parameter obtained for the sample synthesized at the Mn corner was 9.409 ± 0.001 Å
in excellent agreement with the value of 9.4091 Å given in the JCPDS entry #41-1442
for Mn 2 O 3 . This result shows that the lattice parameters obtained in the coexistence
regions were precise, though the noise on any given measurement was significant
and statistics over multiple samples were required. The standard deviation is 0.12 %
of the lattice parameter and this value will be used in this chapter and the next as the
benchmark to identify a phase from which tie-lines fan out.