

72
5 Combinatorial Studies of the Spinel and Rocksalt Regions . . .
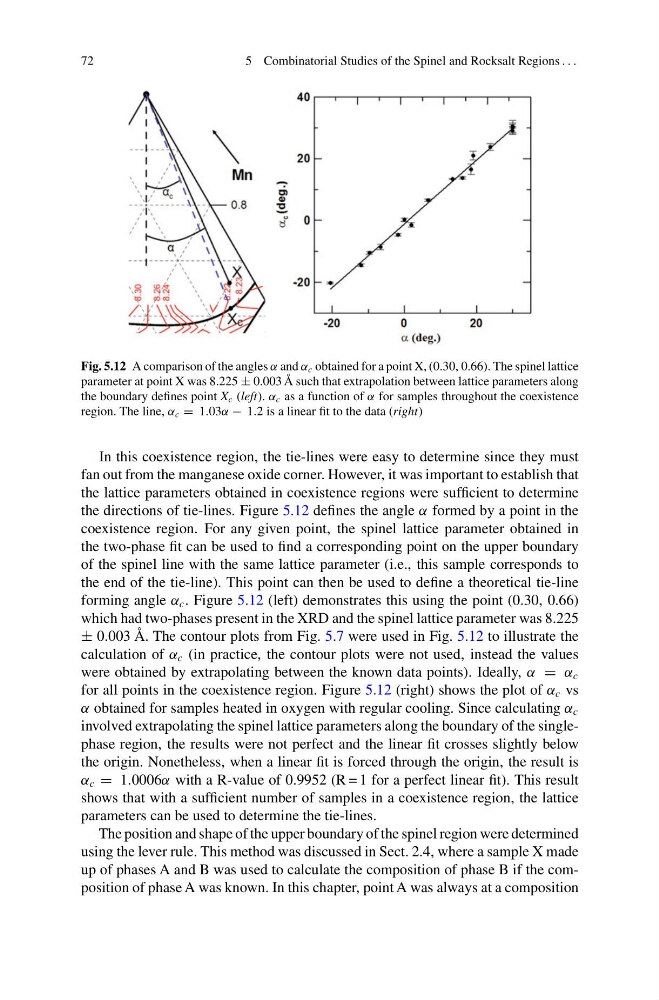
Fig. 5.12 A comparison of the angles α and α c obtained for a point X, (0.30, 0.66). The spinel lattice
parameter at point X was 8.225 ± 0.003 Å such that extrapolation between lattice parameters along
the boundary defines point X c (left). α c as a function of α for samples throughout the coexistence
region. The line, α c = 1.03α − 1.2 is a linear fit to the data (right)
In this coexistence region, the tie-lines were easy to determine since they must
fan out from the manganese oxide corner. However, it was important to establish that
the lattice parameters obtained in coexistence regions were sufficient to determine
the directions of tie-lines. Figure 5.12 defines the angle α formed by a point in the
coexistence region. For any given point, the spinel lattice parameter obtained in
the two-phase fit can be used to find a corresponding point on the upper boundary
of the spinel line with the same lattice parameter (i.e., this sample corresponds to
the end of the tie-line). This point can then be used to define a theoretical tie-line
forming angle α c . Figure 5.12 (left) demonstrates this using the point (0.30, 0.66)
which had two-phases present in the XRD and the spinel lattice parameter was 8.225
± 0.003 Å. The contour plots from Fig. 5.7 were used in Fig. 5.12 to illustrate the
calculation of α c (in practice, the contour plots were not used, instead the values
were obtained by extrapolating between the known data points). Ideally, α = α c
for all points in the coexistence region. Figure 5.12 (right) shows the plot of α c vs
α obtained for samples heated in oxygen with regular cooling. Since calculating α c
involved extrapolating the spinel lattice parameters along the boundary of the singlephase region, the results were not perfect and the linear fit crosses slightly below
the origin. Nonetheless, when a linear fit is forced through the origin, the result is
α c = 1.0006α with a R-value of 0.9952 (R = 1 for a perfect linear fit). This result
shows that with a sufficient number of samples in a coexistence region, the lattice
parameters can be used to determine the tie-lines.
The position and shape of the upper boundary of the spinel region were determined
using the lever rule. This method was discussed in Sect. 2.4, where a sample X made
up of phases A and B was used to calculate the composition of phase B if the composition of phase A was known. In this chapter, point A was always at a composition
5 Combinatorial Studies of the Spinel and Rocksalt Regions . . .
Fig. 5.12 A comparison of the angles α and α c obtained for a point X, (0.30, 0.66). The spinel lattice
parameter at point X was 8.225 ± 0.003 Å such that extrapolation between lattice parameters along
the boundary defines point X c (left). α c as a function of α for samples throughout the coexistence
region. The line, α c = 1.03α − 1.2 is a linear fit to the data (right)
In this coexistence region, the tie-lines were easy to determine since they must
fan out from the manganese oxide corner. However, it was important to establish that
the lattice parameters obtained in coexistence regions were sufficient to determine
the directions of tie-lines. Figure 5.12 defines the angle α formed by a point in the
coexistence region. For any given point, the spinel lattice parameter obtained in
the two-phase fit can be used to find a corresponding point on the upper boundary
of the spinel line with the same lattice parameter (i.e., this sample corresponds to
the end of the tie-line). This point can then be used to define a theoretical tie-line
forming angle α c . Figure 5.12 (left) demonstrates this using the point (0.30, 0.66)
which had two-phases present in the XRD and the spinel lattice parameter was 8.225
± 0.003 Å. The contour plots from Fig. 5.7 were used in Fig. 5.12 to illustrate the
calculation of α c (in practice, the contour plots were not used, instead the values
were obtained by extrapolating between the known data points). Ideally, α = α c
for all points in the coexistence region. Figure 5.12 (right) shows the plot of α c vs
α obtained for samples heated in oxygen with regular cooling. Since calculating α c
involved extrapolating the spinel lattice parameters along the boundary of the singlephase region, the results were not perfect and the linear fit crosses slightly below
the origin. Nonetheless, when a linear fit is forced through the origin, the result is
α c = 1.0006α with a R-value of 0.9952 (R = 1 for a perfect linear fit). This result
shows that with a sufficient number of samples in a coexistence region, the lattice
parameters can be used to determine the tie-lines.
The position and shape of the upper boundary of the spinel region were determined
using the lever rule. This method was discussed in Sect. 2.4, where a sample X made
up of phases A and B was used to calculate the composition of phase B if the composition of phase A was known. In this chapter, point A was always at a composition