

5.3 Rocksalt Single-Phase Region
69
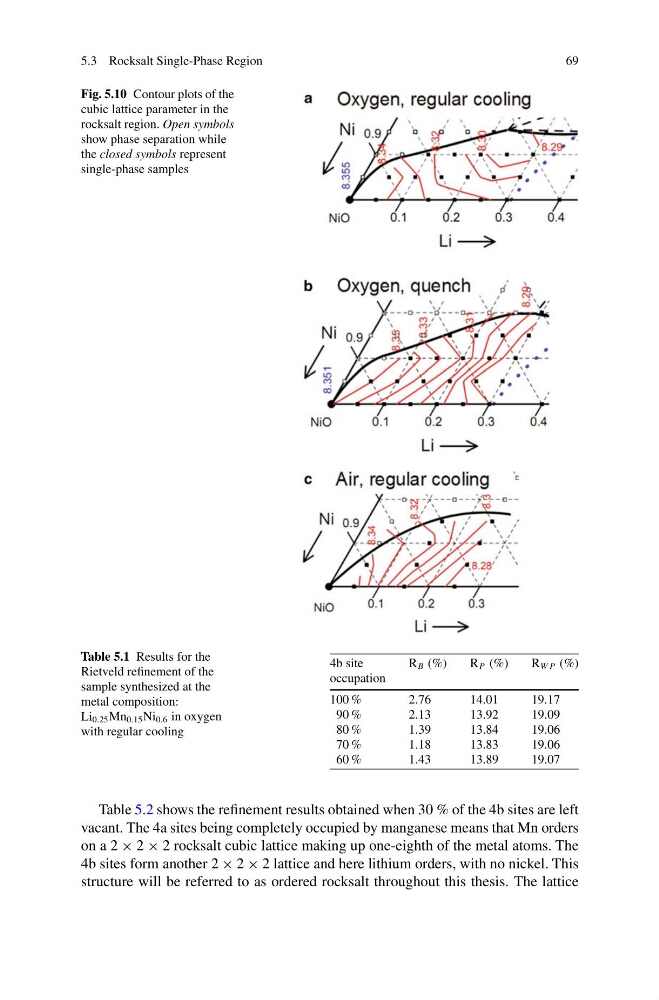
Fig. 5.10 Contour plots of the
cubic lattice parameter in the
rocksalt region. Open symbols
show phase separation while
the closed symbols represent
single-phase samples
Table 5.1 Results for the
Rietveld refinement of the
sample synthesized at the
metal composition:
Li 0.25 Mn 0.15 Ni 0.6 in oxygen
with regular cooling
4b site
R B (%)
R P (%)
R W P (%)
occupation
100 %
2.76
14.01
19.17
90 %
2.13
13.92
19.09
80 %
1.39
13.84
19.06
70 %
1.18
13.83
19.06
60 %
1.43
13.89
19.07
Table 5.2 shows the refinement results obtained when 30 % of the 4b sites are left
vacant. The 4a sites being completely occupied by manganese means that Mn orders
on a 2 × 2 × 2 rocksalt cubic lattice making up one-eighth of the metal atoms. The
4b sites form another 2 × 2 × 2 lattice and here lithium orders, with no nickel. This
structure will be referred to as ordered rocksalt throughout this thesis. The lattice
69
Fig. 5.10 Contour plots of the
cubic lattice parameter in the
rocksalt region. Open symbols
show phase separation while
the closed symbols represent
single-phase samples
Table 5.1 Results for the
Rietveld refinement of the
sample synthesized at the
metal composition:
Li 0.25 Mn 0.15 Ni 0.6 in oxygen
with regular cooling
4b site
R B (%)
R P (%)
R W P (%)
occupation
100 %
2.76
14.01
19.17
90 %
2.13
13.92
19.09
80 %
1.39
13.84
19.06
70 %
1.18
13.83
19.06
60 %
1.43
13.89
19.07
Table 5.2 shows the refinement results obtained when 30 % of the 4b sites are left
vacant. The 4a sites being completely occupied by manganese means that Mn orders
on a 2 × 2 × 2 rocksalt cubic lattice making up one-eighth of the metal atoms. The
4b sites form another 2 × 2 × 2 lattice and here lithium orders, with no nickel. This
structure will be referred to as ordered rocksalt throughout this thesis. The lattice