

64
5 Combinatorial Studies of the Spinel and Rocksalt Regions . . .
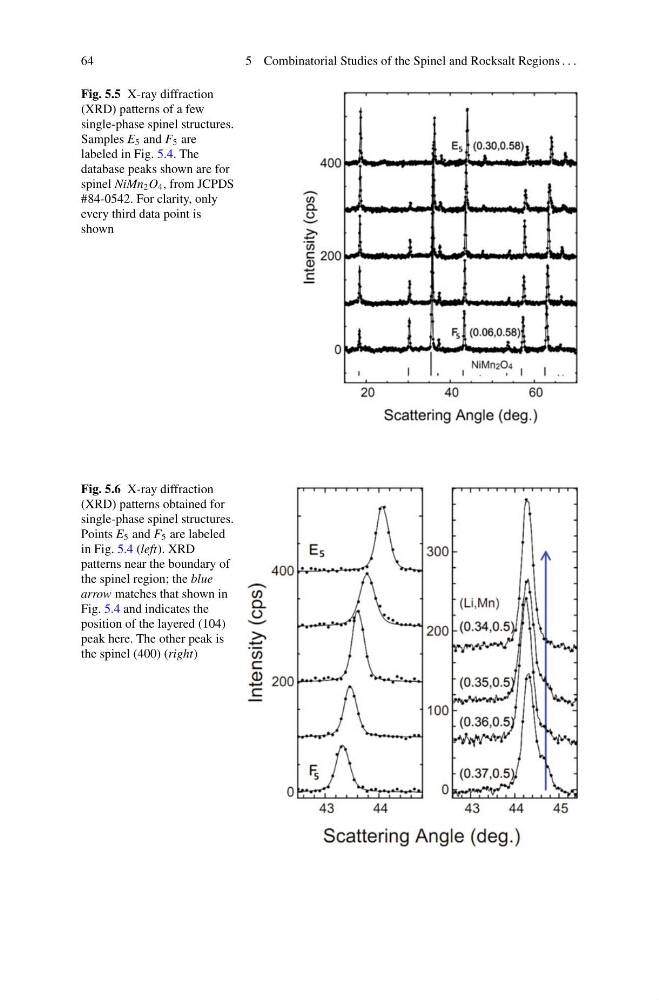
Fig. 5.5 X-ray diffraction
(XRD) patterns of a few
single-phase spinel structures.
Samples E 5 and F 5 are
labeled in Fig. 5.4. The
database peaks shown are for
spinel NiMn 2 O 4 , from JCPDS
#84-0542. For clarity, only
every third data point is
shown
Fig. 5.6 X-ray diffraction
(XRD) patterns obtained for
single-phase spinel structures.
Points E 5 and F 5 are labeled
in Fig. 5.4 (left). XRD
patterns near the boundary of
the spinel region; the blue
arrow matches that shown in
Fig. 5.4 and indicates the
position of the layered (104)
peak here. The other peak is
the spinel (400) (right)
5 Combinatorial Studies of the Spinel and Rocksalt Regions . . .
Fig. 5.5 X-ray diffraction
(XRD) patterns of a few
single-phase spinel structures.
Samples E 5 and F 5 are
labeled in Fig. 5.4. The
database peaks shown are for
spinel NiMn 2 O 4 , from JCPDS
#84-0542. For clarity, only
every third data point is
shown
Fig. 5.6 X-ray diffraction
(XRD) patterns obtained for
single-phase spinel structures.
Points E 5 and F 5 are labeled
in Fig. 5.4 (left). XRD
patterns near the boundary of
the spinel region; the blue
arrow matches that shown in
Fig. 5.4 and indicates the
position of the layered (104)
peak here. The other peak is
the spinel (400) (right)