

5.2 Spinel Single-Phase Region
65
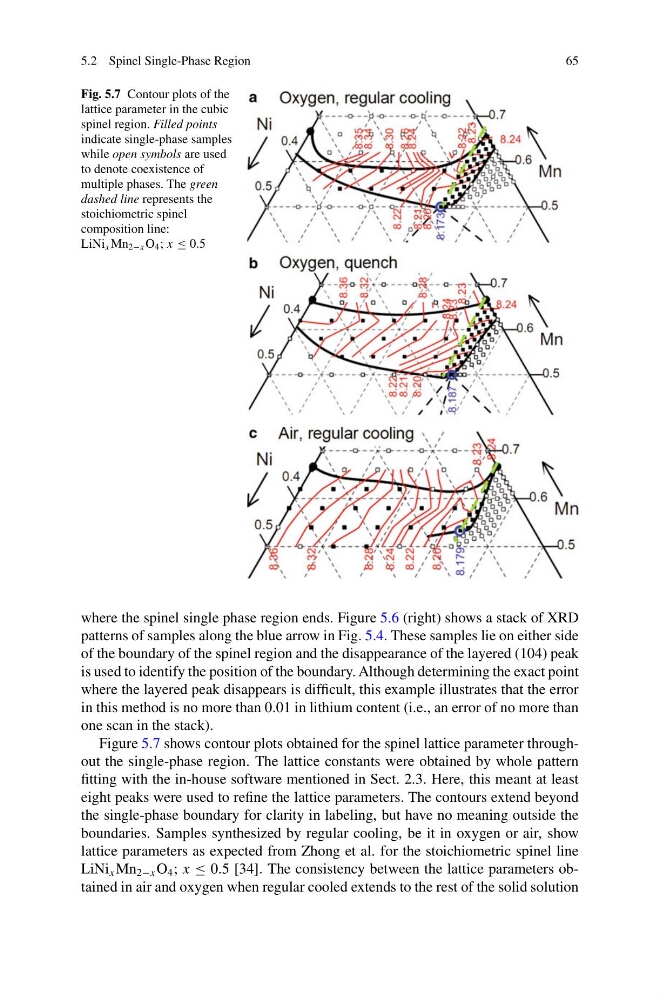
Fig. 5.7 Contour plots of the
lattice parameter in the cubic
spinel region. Filled points
indicate single-phase samples
while open symbols are used
to denote coexistence of
multiple phases. The green
dashed line represents the
stoichiometric spinel
composition line:
LiNi x Mn 2−x O 4 ; x ≤ 0.5
where the spinel single phase region ends. Figure 5.6 (right) shows a stack of XRD
patterns of samples along the blue arrow in Fig. 5.4. These samples lie on either side
of the boundary of the spinel region and the disappearance of the layered (104) peak
is used to identify the position of the boundary. Although determining the exact point
where the layered peak disappears is difficult, this example illustrates that the error
in this method is no more than 0.01 in lithium content (i.e., an error of no more than
one scan in the stack).
Figure 5.7 shows contour plots obtained for the spinel lattice parameter throughout the single-phase region. The lattice constants were obtained by whole pattern
fitting with the in-house software mentioned in Sect. 2.3. Here, this meant at least
eight peaks were used to refine the lattice parameters. The contours extend beyond
the single-phase boundary for clarity in labeling, but have no meaning outside the
boundaries. Samples synthesized by regular cooling, be it in oxygen or air, show
lattice parameters as expected from Zhong et al. for the stoichiometric spinel line
LiNi x Mn 2−x O 4 ; x ≤ 0.5 [34]. The consistency between the lattice parameters obtained in air and oxygen when regular cooled extends to the rest of the solid solution
65
Fig. 5.7 Contour plots of the
lattice parameter in the cubic
spinel region. Filled points
indicate single-phase samples
while open symbols are used
to denote coexistence of
multiple phases. The green
dashed line represents the
stoichiometric spinel
composition line:
LiNi x Mn 2−x O 4 ; x ≤ 0.5
where the spinel single phase region ends. Figure 5.6 (right) shows a stack of XRD
patterns of samples along the blue arrow in Fig. 5.4. These samples lie on either side
of the boundary of the spinel region and the disappearance of the layered (104) peak
is used to identify the position of the boundary. Although determining the exact point
where the layered peak disappears is difficult, this example illustrates that the error
in this method is no more than 0.01 in lithium content (i.e., an error of no more than
one scan in the stack).
Figure 5.7 shows contour plots obtained for the spinel lattice parameter throughout the single-phase region. The lattice constants were obtained by whole pattern
fitting with the in-house software mentioned in Sect. 2.3. Here, this meant at least
eight peaks were used to refine the lattice parameters. The contours extend beyond
the single-phase boundary for clarity in labeling, but have no meaning outside the
boundaries. Samples synthesized by regular cooling, be it in oxygen or air, show
lattice parameters as expected from Zhong et al. for the stoichiometric spinel line
LiNi x Mn 2−x O 4 ; x ≤ 0.5 [34]. The consistency between the lattice parameters obtained in air and oxygen when regular cooled extends to the rest of the solid solution