

5.2 Spinel Single-Phase Region
63
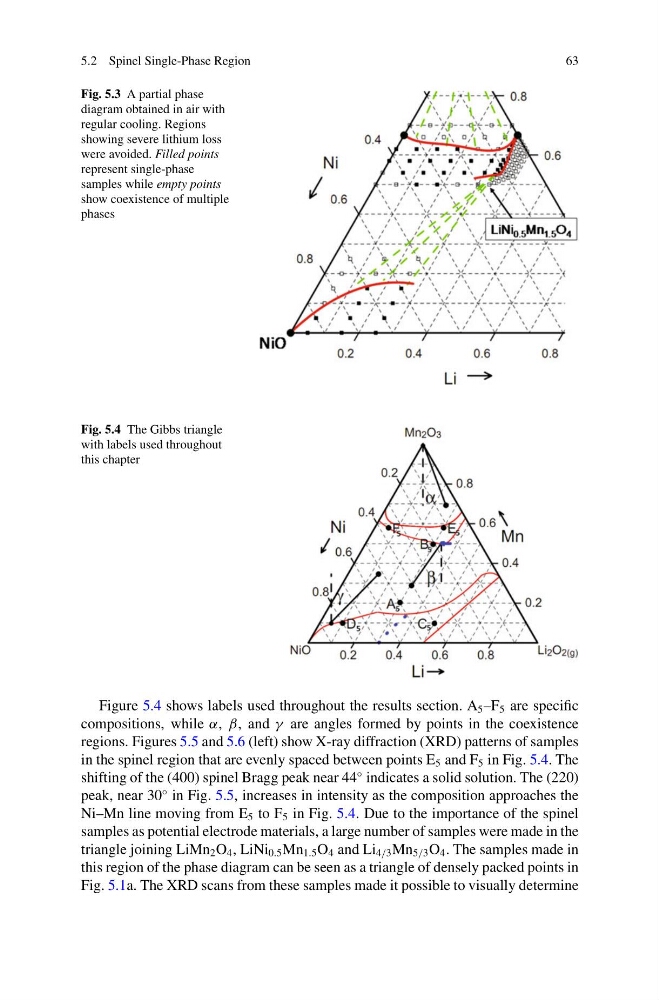
Fig. 5.3 A partial phase
diagram obtained in air with
regular cooling. Regions
showing severe lithium loss
were avoided. Filled points
represent single-phase
samples while empty points
show coexistence of multiple
phases
Fig. 5.4 The Gibbs triangle
with labels used throughout
this chapter
Figure 5.4 shows labels used throughout the results section. A 5 –F 5 are specific
compositions, while α, β, and γ are angles formed by points in the coexistence
regions. Figures 5.5 and 5.6 (left) show X-ray diffraction (XRD) patterns of samples
in the spinel region that are evenly spaced between points E 5 and F 5 in Fig. 5.4. The
shifting of the (400) spinel Bragg peak near 44
◦ indicates a solid solution. The (220)
peak, near 30
◦ in Fig. 5.5, increases in intensity as the composition approaches the
Ni–Mn line moving from E 5 to F 5 in Fig. 5.4. Due to the importance of the spinel
samples as potential electrode materials, a large number of samples were made in the
triangle joining LiMn 2 O 4 , LiNi 0.5 Mn 1.5 O 4 and Li 4/3 Mn 5/3 O 4 . The samples made in
this region of the phase diagram can be seen as a triangle of densely packed points in
Fig. 5.1a. The XRD scans from these samples made it possible to visually determine
63
Fig. 5.3 A partial phase
diagram obtained in air with
regular cooling. Regions
showing severe lithium loss
were avoided. Filled points
represent single-phase
samples while empty points
show coexistence of multiple
phases
Fig. 5.4 The Gibbs triangle
with labels used throughout
this chapter
Figure 5.4 shows labels used throughout the results section. A 5 –F 5 are specific
compositions, while α, β, and γ are angles formed by points in the coexistence
regions. Figures 5.5 and 5.6 (left) show X-ray diffraction (XRD) patterns of samples
in the spinel region that are evenly spaced between points E 5 and F 5 in Fig. 5.4. The
shifting of the (400) spinel Bragg peak near 44
◦ indicates a solid solution. The (220)
peak, near 30
◦ in Fig. 5.5, increases in intensity as the composition approaches the
Ni–Mn line moving from E 5 to F 5 in Fig. 5.4. Due to the importance of the spinel
samples as potential electrode materials, a large number of samples were made in the
triangle joining LiMn 2 O 4 , LiNi 0.5 Mn 1.5 O 4 and Li 4/3 Mn 5/3 O 4 . The samples made in
this region of the phase diagram can be seen as a triangle of densely packed points in
Fig. 5.1a. The XRD scans from these samples made it possible to visually determine