

62
5 Combinatorial Studies of the Spinel and Rocksalt Regions . . .
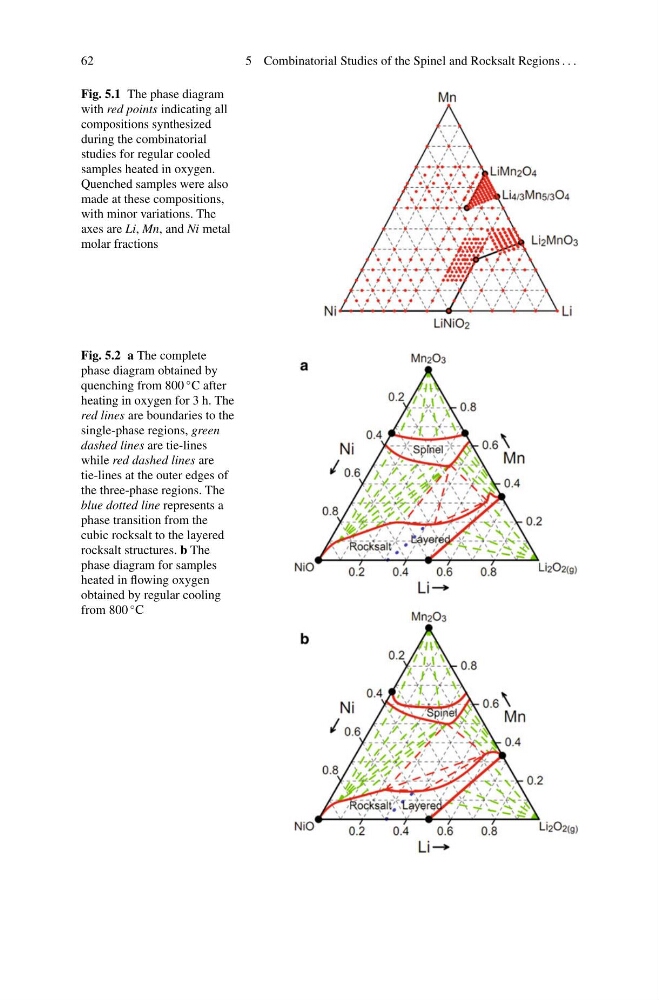
Fig. 5.1 The phase diagram
with red points indicating all
compositions synthesized
during the combinatorial
studies for regular cooled
samples heated in oxygen.
Quenched samples were also
made at these compositions,
with minor variations. The
axes are Li, Mn, and Ni metal
molar fractions
Fig. 5.2 a The complete
phase diagram obtained by
quenching from 800
◦ C after
heating in oxygen for 3 h. The
red lines are boundaries to the
single-phase regions, green
dashed lines are tie-lines
while red dashed lines are
tie-lines at the outer edges of
the three-phase regions. The
blue dotted line represents a
phase transition from the
cubic rocksalt to the layered
rocksalt structures. b The
phase diagram for samples
heated in flowing oxygen
obtained by regular cooling
from 800
◦ C
5 Combinatorial Studies of the Spinel and Rocksalt Regions . . .
Fig. 5.1 The phase diagram
with red points indicating all
compositions synthesized
during the combinatorial
studies for regular cooled
samples heated in oxygen.
Quenched samples were also
made at these compositions,
with minor variations. The
axes are Li, Mn, and Ni metal
molar fractions
Fig. 5.2 a The complete
phase diagram obtained by
quenching from 800
◦ C after
heating in oxygen for 3 h. The
red lines are boundaries to the
single-phase regions, green
dashed lines are tie-lines
while red dashed lines are
tie-lines at the outer edges of
the three-phase regions. The
blue dotted line represents a
phase transition from the
cubic rocksalt to the layered
rocksalt structures. b The
phase diagram for samples
heated in flowing oxygen
obtained by regular cooling
from 800
◦ C