

56
4 Combinatorial Studies in the Li–Co–Mn–O System
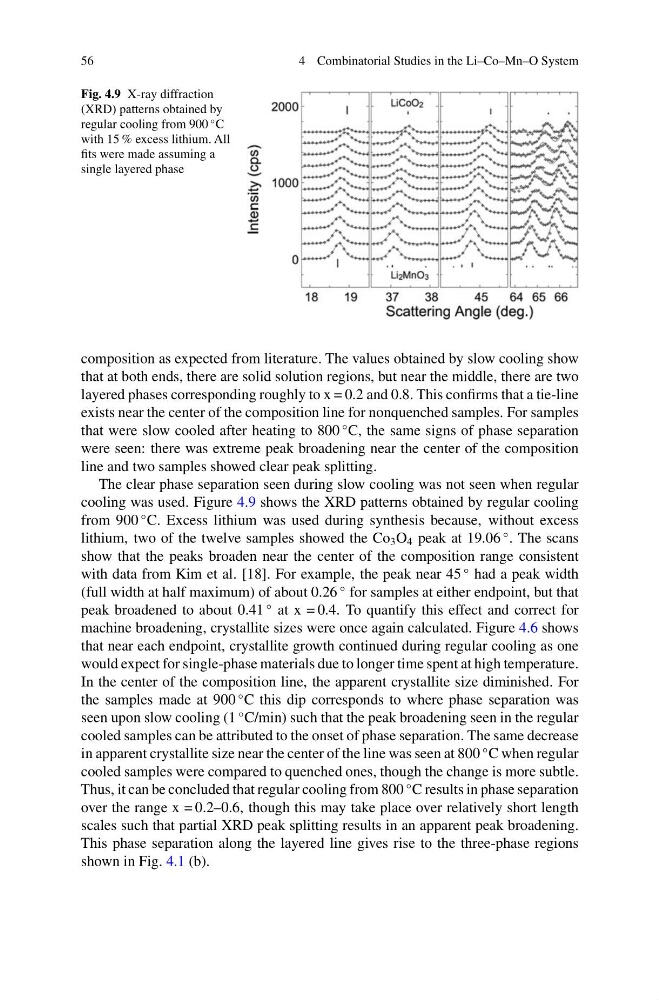
Fig. 4.9 X-ray diffraction
(XRD) patterns obtained by
regular cooling from 900
◦ C
with 15 % excess lithium. All
fits were made assuming a
single layered phase
composition as expected from literature. The values obtained by slow cooling show
that at both ends, there are solid solution regions, but near the middle, there are two
layered phases corresponding roughly to x = 0.2 and 0.8. This confirms that a tie-line
exists near the center of the composition line for nonquenched samples. For samples
that were slow cooled after heating to 800
◦ C, the same signs of phase separation
were seen: there was extreme peak broadening near the center of the composition
line and two samples showed clear peak splitting.
The clear phase separation seen during slow cooling was not seen when regular
cooling was used. Figure 4.9 shows the XRD patterns obtained by regular cooling
from 900
◦ C. Excess lithium was used during synthesis because, without excess
lithium, two of the twelve samples showed the Co 3 O 4 peak at 19.06
◦ . The scans
show that the peaks broaden near the center of the composition range consistent
with data from Kim et al. [18]. For example, the peak near 45
◦ had a peak width
(full width at half maximum) of about 0.26
◦ for samples at either endpoint, but that
peak broadened to about 0.41
◦ at x = 0.4. To quantify this effect and correct for
machine broadening, crystallite sizes were once again calculated. Figure 4.6 shows
that near each endpoint, crystallite growth continued during regular cooling as one
would expect for single-phase materials due to longer time spent at high temperature.
In the center of the composition line, the apparent crystallite size diminished. For
the samples made at 900
◦ C this dip corresponds to where phase separation was
seen upon slow cooling (1
◦ C/min) such that the peak broadening seen in the regular
cooled samples can be attributed to the onset of phase separation. The same decrease
in apparent crystallite size near the center of the line was seen at 800
◦ C when regular
cooled samples were compared to quenched ones, though the change is more subtle.
Thus, it can be concluded that regular cooling from 800
◦ C results in phase separation
over the range x = 0.2–0.6, though this may take place over relatively short length
scales such that partial XRD peak splitting results in an apparent peak broadening.
This phase separation along the layered line gives rise to the three-phase regions
shown in Fig. 4.1 (b).
4 Combinatorial Studies in the Li–Co–Mn–O System
Fig. 4.9 X-ray diffraction
(XRD) patterns obtained by
regular cooling from 900
◦ C
with 15 % excess lithium. All
fits were made assuming a
single layered phase
composition as expected from literature. The values obtained by slow cooling show
that at both ends, there are solid solution regions, but near the middle, there are two
layered phases corresponding roughly to x = 0.2 and 0.8. This confirms that a tie-line
exists near the center of the composition line for nonquenched samples. For samples
that were slow cooled after heating to 800
◦ C, the same signs of phase separation
were seen: there was extreme peak broadening near the center of the composition
line and two samples showed clear peak splitting.
The clear phase separation seen during slow cooling was not seen when regular
cooling was used. Figure 4.9 shows the XRD patterns obtained by regular cooling
from 900
◦ C. Excess lithium was used during synthesis because, without excess
lithium, two of the twelve samples showed the Co 3 O 4 peak at 19.06
◦ . The scans
show that the peaks broaden near the center of the composition range consistent
with data from Kim et al. [18]. For example, the peak near 45
◦ had a peak width
(full width at half maximum) of about 0.26
◦ for samples at either endpoint, but that
peak broadened to about 0.41
◦ at x = 0.4. To quantify this effect and correct for
machine broadening, crystallite sizes were once again calculated. Figure 4.6 shows
that near each endpoint, crystallite growth continued during regular cooling as one
would expect for single-phase materials due to longer time spent at high temperature.
In the center of the composition line, the apparent crystallite size diminished. For
the samples made at 900
◦ C this dip corresponds to where phase separation was
seen upon slow cooling (1
◦ C/min) such that the peak broadening seen in the regular
cooled samples can be attributed to the onset of phase separation. The same decrease
in apparent crystallite size near the center of the line was seen at 800
◦ C when regular
cooled samples were compared to quenched ones, though the change is more subtle.
Thus, it can be concluded that regular cooling from 800
◦ C results in phase separation
over the range x = 0.2–0.6, though this may take place over relatively short length
scales such that partial XRD peak splitting results in an apparent peak broadening.
This phase separation along the layered line gives rise to the three-phase regions
shown in Fig. 4.1 (b).