

4.3 LiCoO 2 –Li 2 MnO 3
55
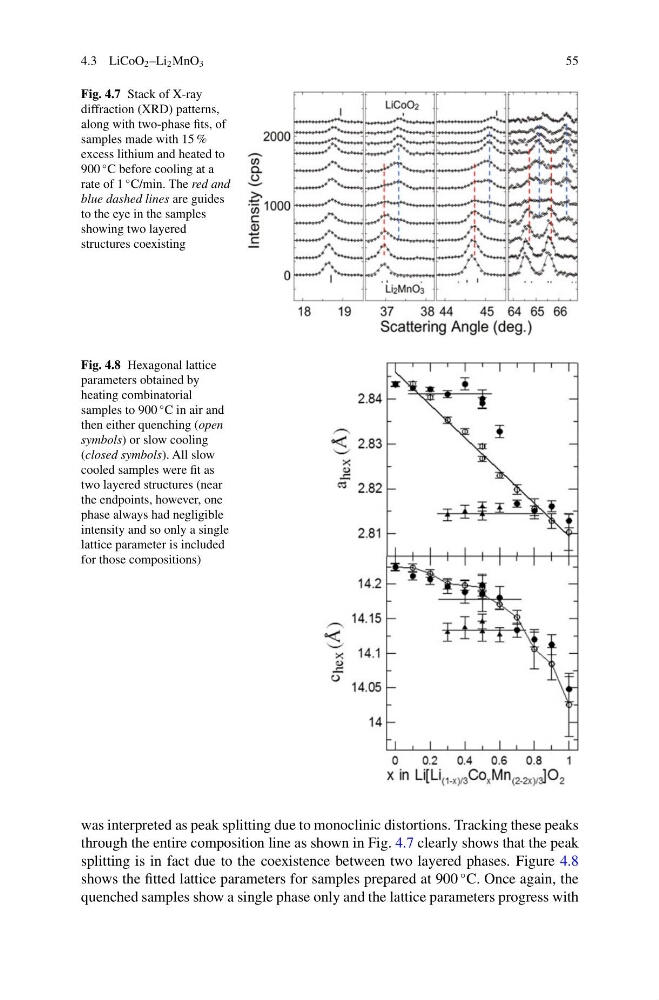
Fig. 4.7 Stack of X-ray
diffraction (XRD) patterns,
along with two-phase fits, of
samples made with 15 %
excess lithium and heated to
900
◦ C before cooling at a
rate of 1
◦ C/min. The red and
blue dashed lines are guides
to the eye in the samples
showing two layered
structures coexisting
Fig. 4.8 Hexagonal lattice
parameters obtained by
heating combinatorial
samples to 900
◦ C in air and
then either quenching (open
symbols) or slow cooling
(closed symbols). All slow
cooled samples were fit as
two layered structures (near
the endpoints, however, one
phase always had negligible
intensity and so only a single
lattice parameter is included
for those compositions)
was interpreted as peak splitting due to monoclinic distortions. Tracking these peaks
through the entire composition line as shown in Fig. 4.7 clearly shows that the peak
splitting is in fact due to the coexistence between two layered phases. Figure 4.8
shows the fitted lattice parameters for samples prepared at 900
◦ C. Once again, the
quenched samples show a single phase only and the lattice parameters progress with
55
Fig. 4.7 Stack of X-ray
diffraction (XRD) patterns,
along with two-phase fits, of
samples made with 15 %
excess lithium and heated to
900
◦ C before cooling at a
rate of 1
◦ C/min. The red and
blue dashed lines are guides
to the eye in the samples
showing two layered
structures coexisting
Fig. 4.8 Hexagonal lattice
parameters obtained by
heating combinatorial
samples to 900
◦ C in air and
then either quenching (open
symbols) or slow cooling
(closed symbols). All slow
cooled samples were fit as
two layered structures (near
the endpoints, however, one
phase always had negligible
intensity and so only a single
lattice parameter is included
for those compositions)
was interpreted as peak splitting due to monoclinic distortions. Tracking these peaks
through the entire composition line as shown in Fig. 4.7 clearly shows that the peak
splitting is in fact due to the coexistence between two layered phases. Figure 4.8
shows the fitted lattice parameters for samples prepared at 900
◦ C. Once again, the
quenched samples show a single phase only and the lattice parameters progress with