

54
4 Combinatorial Studies in the Li–Co–Mn–O System
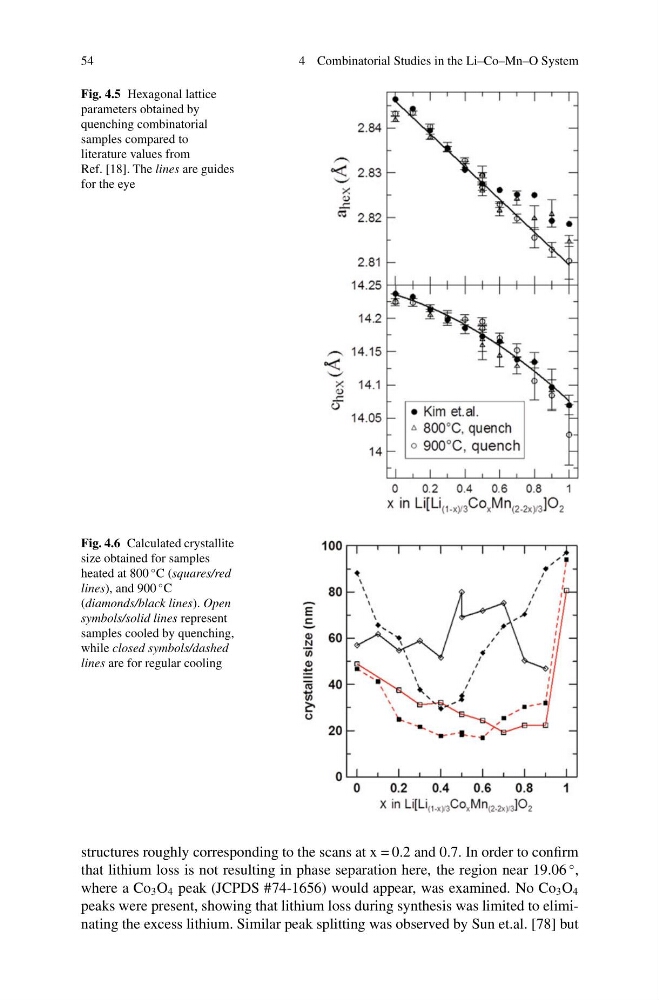
Fig. 4.5 Hexagonal lattice
parameters obtained by
quenching combinatorial
samples compared to
literature values from
Ref. [18]. The lines are guides
for the eye
Fig. 4.6 Calculated crystallite
size obtained for samples
heated at 800
◦ C (squares/red
lines), and 900
◦ C
(diamonds/black lines). Open
symbols/solid lines represent
samples cooled by quenching,
while closed symbols/dashed
lines are for regular cooling
structures roughly corresponding to the scans at x = 0.2 and 0.7. In order to confirm
that lithium loss is not resulting in phase separation here, the region near 19.06
◦ ,
where a Co 3 O 4 peak (JCPDS #74-1656) would appear, was examined. No Co 3 O 4
peaks were present, showing that lithium loss during synthesis was limited to eliminating the excess lithium. Similar peak splitting was observed by Sun et.al. [78] but
4 Combinatorial Studies in the Li–Co–Mn–O System
Fig. 4.5 Hexagonal lattice
parameters obtained by
quenching combinatorial
samples compared to
literature values from
Ref. [18]. The lines are guides
for the eye
Fig. 4.6 Calculated crystallite
size obtained for samples
heated at 800
◦ C (squares/red
lines), and 900
◦ C
(diamonds/black lines). Open
symbols/solid lines represent
samples cooled by quenching,
while closed symbols/dashed
lines are for regular cooling
structures roughly corresponding to the scans at x = 0.2 and 0.7. In order to confirm
that lithium loss is not resulting in phase separation here, the region near 19.06
◦ ,
where a Co 3 O 4 peak (JCPDS #74-1656) would appear, was examined. No Co 3 O 4
peaks were present, showing that lithium loss during synthesis was limited to eliminating the excess lithium. Similar peak splitting was observed by Sun et.al. [78] but