

4.3 LiCoO 2 –Li 2 MnO 3
53
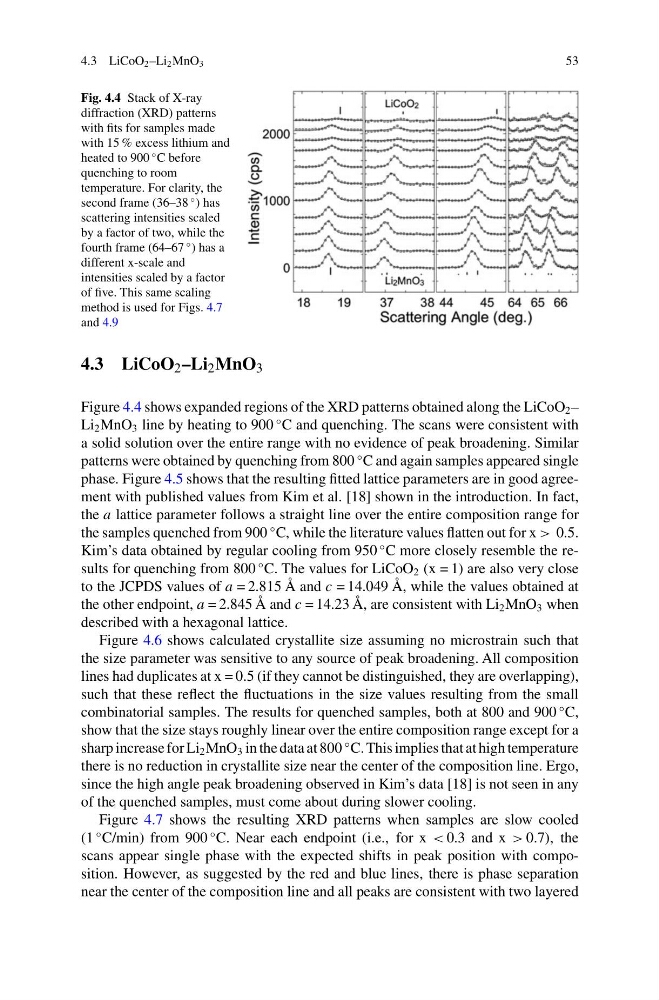
Fig. 4.4 Stack of X-ray
diffraction (XRD) patterns
with fits for samples made
with 15 % excess lithium and
heated to 900
◦ C before
quenching to room
temperature. For clarity, the
second frame (36–38
◦ ) has
scattering intensities scaled
by a factor of two, while the
fourth frame (64–67
◦ ) has a
different x-scale and
intensities scaled by a factor
of five. This same scaling
method is used for Figs. 4.7
and 4.9
4.3 LiCoO 2 –Li 2 MnO 3
Figure 4.4 shows expanded regions of the XRD patterns obtained along the LiCoO 2 –
Li 2 MnO 3 line by heating to 900
◦ C and quenching. The scans were consistent with
a solid solution over the entire range with no evidence of peak broadening. Similar
patterns were obtained by quenching from 800
◦ C and again samples appeared single
phase. Figure 4.5 shows that the resulting fitted lattice parameters are in good agreement with published values from Kim et al. [18] shown in the introduction. In fact,
the a lattice parameter follows a straight line over the entire composition range for
the samples quenched from 900
◦ C, while the literature values flatten out for x > 0.5.
Kim’s data obtained by regular cooling from 950
◦ C more closely resemble the results for quenching from 800
◦ C. The values for LiCoO 2 (x = 1) are also very close
to the JCPDS values of a = 2.815 Å and c = 14.049 Å, while the values obtained at
the other endpoint, a = 2.845 Å and c = 14.23 Å, are consistent with Li 2 MnO 3 when
described with a hexagonal lattice.
Figure 4.6 shows calculated crystallite size assuming no microstrain such that
the size parameter was sensitive to any source of peak broadening. All composition
lines had duplicates at x = 0.5 (if they cannot be distinguished, they are overlapping),
such that these reflect the fluctuations in the size values resulting from the small
combinatorial samples. The results for quenched samples, both at 800 and 900
◦ C,
show that the size stays roughly linear over the entire composition range except for a
sharp increase for Li 2 MnO 3 in the data at 800
◦ C. This implies that at high temperature
there is no reduction in crystallite size near the center of the composition line. Ergo,
since the high angle peak broadening observed in Kim’s data [18] is not seen in any
of the quenched samples, must come about during slower cooling.
Figure 4.7 shows the resulting XRD patterns when samples are slow cooled
(1
◦ C/min) from 900
◦ C. Near each endpoint (i.e., for x < 0.3 and x > 0.7), the
scans appear single phase with the expected shifts in peak position with composition. However, as suggested by the red and blue lines, there is phase separation
near the center of the composition line and all peaks are consistent with two layered
53
Fig. 4.4 Stack of X-ray
diffraction (XRD) patterns
with fits for samples made
with 15 % excess lithium and
heated to 900
◦ C before
quenching to room
temperature. For clarity, the
second frame (36–38
◦ ) has
scattering intensities scaled
by a factor of two, while the
fourth frame (64–67
◦ ) has a
different x-scale and
intensities scaled by a factor
of five. This same scaling
method is used for Figs. 4.7
and 4.9
4.3 LiCoO 2 –Li 2 MnO 3
Figure 4.4 shows expanded regions of the XRD patterns obtained along the LiCoO 2 –
Li 2 MnO 3 line by heating to 900
◦ C and quenching. The scans were consistent with
a solid solution over the entire range with no evidence of peak broadening. Similar
patterns were obtained by quenching from 800
◦ C and again samples appeared single
phase. Figure 4.5 shows that the resulting fitted lattice parameters are in good agreement with published values from Kim et al. [18] shown in the introduction. In fact,
the a lattice parameter follows a straight line over the entire composition range for
the samples quenched from 900
◦ C, while the literature values flatten out for x > 0.5.
Kim’s data obtained by regular cooling from 950
◦ C more closely resemble the results for quenching from 800
◦ C. The values for LiCoO 2 (x = 1) are also very close
to the JCPDS values of a = 2.815 Å and c = 14.049 Å, while the values obtained at
the other endpoint, a = 2.845 Å and c = 14.23 Å, are consistent with Li 2 MnO 3 when
described with a hexagonal lattice.
Figure 4.6 shows calculated crystallite size assuming no microstrain such that
the size parameter was sensitive to any source of peak broadening. All composition
lines had duplicates at x = 0.5 (if they cannot be distinguished, they are overlapping),
such that these reflect the fluctuations in the size values resulting from the small
combinatorial samples. The results for quenched samples, both at 800 and 900
◦ C,
show that the size stays roughly linear over the entire composition range except for a
sharp increase for Li 2 MnO 3 in the data at 800
◦ C. This implies that at high temperature
there is no reduction in crystallite size near the center of the composition line. Ergo,
since the high angle peak broadening observed in Kim’s data [18] is not seen in any
of the quenched samples, must come about during slower cooling.
Figure 4.7 shows the resulting XRD patterns when samples are slow cooled
(1
◦ C/min) from 900
◦ C. Near each endpoint (i.e., for x < 0.3 and x > 0.7), the
scans appear single phase with the expected shifts in peak position with composition. However, as suggested by the red and blue lines, there is phase separation
near the center of the composition line and all peaks are consistent with two layered